Topics
There is funding for 1,000 measurements. One proposal recruits 20 people and measures each of them 50 times. Another recruits 200 people and measures each of them five times.
Both proposals produce a table with 1,000 rows. They do not produce the same information.
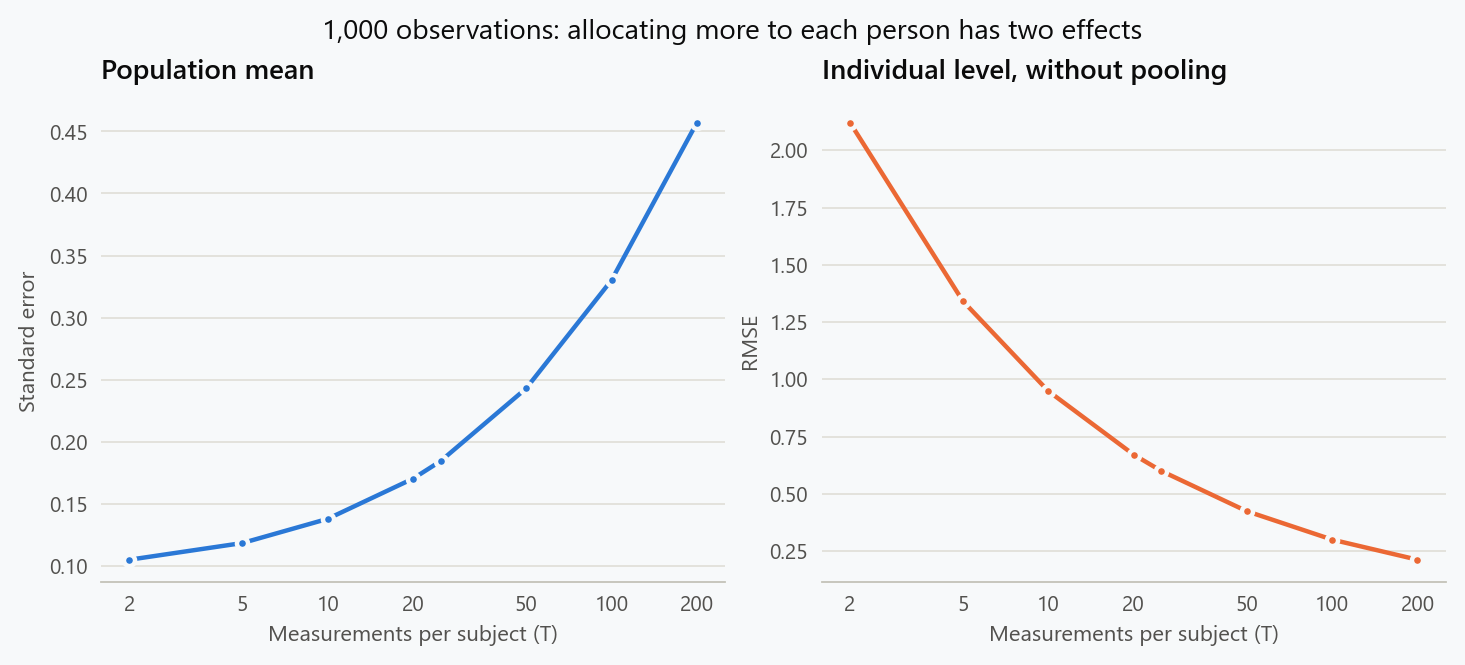
In the example below, the second design estimates the population mean about twice as precisely. The first estimates each person's underlying level about three times as precisely. Neither statement is a contradiction, because the targets are different.
The design question is therefore more specific than “How much data do we need?” We need to decide which uncertainty the next measurement should reduce.
Separate people from measurement noise
Start with a balanced random-intercept model:
There are $n$ independently sampled people and $T$ measurements per person. The random effects and all measurement errors are mutually independent. Each person's underlying level is $\theta_i=\mu+b_i$.
The model deliberately omits trends, serially correlated errors, and informative observation times. Here $T$ is a measurement count. Extending an actual trajectory in time introduces further questions, which we will return to.
The separation between population parameters, individual effects, and within-person variation is the central construction in random-effects models for longitudinal data. Laird and Ware, Random-Effects Models for Longitudinal Data.
The person's observed mean is
More measurements reduce uncertainty about that person's level. They do not create another independent draw of $b_i$ from the population.
Two targets imply two error calculations
For the population mean, use the average of the person means:
Its variance is
The two terms have different meanings. The first is uncertainty from sampling a finite number of people. The second is the contribution of noisy measurements. Repeating measurements reduces only the second term when $n$ is fixed.
For a particular person's level, the unpooled estimator is simply $\widehat\theta_i=\bar Y_i$. Conditional on that person's level, its mean squared error is
Recruiting additional people does not improve this unpooled estimate of person $i$. Those additional people help estimate the population and, in a hierarchical analysis, the distribution used for pooling. They cannot supply unlimited information about the unexplained part of person $i$'s own state.
Keep the row budget fixed
Let the total observation count be $B=nT=1000$, with $\tau^2=1$ and $\sigma^2=9$. These are planning assumptions in arbitrary outcome units, not estimates from an empirical study.
| People $n$ | Measurements each $T$ | Population mean SE | Individual unpooled RMSE |
|---|---|---|---|
| 20 | 50 | 0.243 | 0.424 |
| 50 | 20 | 0.170 | 0.671 |
| 100 | 10 | 0.138 | 0.949 |
| 200 | 5 | 0.118 | 1.342 |
The population mean gains precision as we recruit more people. The individual estimate loses precision as we take fewer measurements from each person.
Under this fixed observation budget,
With positive between-person variance, increasing $T$ increases this variance because it reduces the number of people available. If the only target were $\mu$, recruiting were free, and the model were correct, the formula would favor the smallest feasible $T$.
Those qualifications matter. A design with one measurement per person cannot separately identify $\tau^2$ and $\sigma^2$ from this dataset alone. It may estimate the population mean well while failing at another purpose of the study.
Check the calculation with a simulation
We can simulate each person's mean directly: the average of $T$ independent Gaussian errors is Gaussian with variance $\sigma^2/T$. That is an exact reduction for this model, not an approximation that applies to arbitrary trajectories.
1
2
3
4
5
6
7
8
9
10
11
12
13
14
15
16
17
from math import sqrt
import numpy as np

rng = np.random.default_rng(20260921)
replications = 10_000

for n, t in [(20, 50), (50, 20), (100, 10), (200, 5)]:
    measurement_error = rng.normal(0, 3 / sqrt(t), (replications, n))
    person_level = rng.normal(0, 1, (replications, n))
    person_mean = person_level + measurement_error
    estimates = person_mean.mean(axis=1)

    analytic_se = sqrt((1 + 9 / t) / n)
    simulated_se = estimates.std(ddof=1)
    individual_rmse = sqrt(np.mean(measurement_error**2))
    print(n, t, f"SE: {analytic_se:.3f} / {simulated_se:.3f}",
          f"individual RMSE: {individual_rmse:.3f}")
With NumPy 2.3.5, the simulated population standard errors are 0.241, 0.171, 0.137, and 0.119. They agree with the analytic values to the precision expected from 10,000 replications. For Gaussian estimates, the relative Monte Carlo uncertainty in an estimated standard deviation is approximately $1/\sqrt{2(R-1)}$, about 0.7 percent here.
This experiment checks the consequences of the assumptions. It does not establish that independence, constant individual levels, or the selected variances describe a real study.
Learning heterogeneity is a third problem
Suppose the target is the variation between people's underlying levels. The variance of observed person means is
If we treat that observed variance as the latent heterogeneity, we count measurement noise as population variation.
When $\sigma^2$ is known, an unbiased estimator is
where $S^2_{\bar Y}$ uses denominator $n-1$. Under the Gaussian model,
For the four designs above, these standard deviations are 0.383, 0.293, 0.270, and 0.281. The design with the most people no longer wins among these four choices. More people improve variance estimation, but noisier person means make separating the components harder.
This estimator can be negative in finite samples. Truncating it at zero changes its bias and sampling distribution, so the stated standard deviation applies to the untruncated estimator. Estimating $\sigma^2$ instead of treating it as known also changes the calculation.
The same distinction appears in longitudinal clustering. Accurately measuring a few trajectories does not provide many independent examples of population structure. Collecting many poorly measured trajectories may instead make the apparent structure partly a consequence of feature noise. A clustering design needs both levels of uncertainty in its evaluation.
Partial pooling helps, with a remaining limit
With $\mu$, $\tau^2$, and $\sigma^2$ known, the Gaussian posterior mean of an individual level is
Its posterior variance is
Pooling reduces the average individual estimation error under the specified model. But at fixed $T$, even perfect knowledge of the population parameters leaves $V_T>0$. Learning the population from arbitrarily many other people cannot remove all uncertainty about a sparsely measured individual.
In practice the population parameters are estimated, and their uncertainty also matters. The known-parameter calculation isolates the limit after that part of the learning problem has been solved. The site's introduction to multilevel operational models discusses why partial pooling is useful in the first place.
More timestamps and a longer time window are different interventions
Now let an individual trajectory have a slope:
With independent errors of variance $\sigma^2$, the ordinary least-squares slope variance is
For measurements at $0,1,\ldots,T-1$,
Increasing $T$ both adds measurements and extends the window, producing a large-$T$ rate proportional to $T^{-3}$.
For $T$ equally spaced measurements over a fixed window $[0,L]$, however,
The rate is then proportional to $T^{-1}$. Denser measurements over one day do not provide the same information about a linear trend as observations spread over several months.
Neither formula justifies indefinite extrapolation. Serial correlation changes the covariance calculation, and a longer window may make a constant slope implausible. The advantage depends on the trajectory model remaining relevant over the added time.
Costs and dependence can change the preferred allocation
The fixed-row example assumed that recruiting a new person costs nothing beyond the measurements. Suppose recruitment costs $c_0$ and each measurement costs $c_1$, with total budget $C$. Then
For the population mean under the original model,
When both variances and both costs are positive, the continuous optimum is
A real design must round to feasible integers and respect minimum follow-up requirements. More expensive recruitment favors more measurements per recruit; larger between-person variation favors more people. This rule optimizes the population mean alone.
Correlated errors also reduce the return from repeated measurement. For stationary errors with marginal variance $\sigma^2$ and lag correlation $\rho_k$,
The independent-error calculation is recovered when every $\rho_k=0$. A burst of nearly identical readings can add many rows with little independent information. Wider spacing may help with short-range dependence, while also changing which temporal behavior the study can resolve.
Choose a design by the uncertainty it must reduce
Before allocating the budget, specify whether the primary target is a population average, an individual's state, between-person variation, or a trajectory feature. Then evaluate the corresponding error under plausible variance components and observation schedules.
Keep the distinction visible in the report. State the number of independent people, measurements per person, duration, spacing, expected dropout, and the role of any pooling model. A row count alone omits the design decisions that determine the information content.
The strongest alternative to this argument is that a sufficiently good hierarchical model can share information across both dimensions. It can, and that is a reason to use such models. It is still necessary to distinguish which parameters are learned from additional people and which require observing the same person more closely.
The figure and numerical tables can be regenerated with poetry run python scripts/figures/statistics/longitudinal_design.py from the reproducibility repository. The reproduction script uses NumPy and Matplotlib and generates only synthetic data.
Embed interactive plots, widgets, and demos using <figure>, <iframe>, or <div class="interactive-embed"> containers. Ensure each embed includes descriptive captions for accessibility.
How to cite
Use the quick export buttons to save citations for reference managers or copy the formatted text directly.
Diogo Ribeiro (2026). More Subjects and Longer Trajectories Solve Different Problems. Faculty of Media Arts and Design, Technical University of Porto. https://diogoribeiro7.github.io/statistics/more_subjects_and_longer_trajectories/.
