Topics
An internal audit ran the first-digit test on a year of expense claims and got a p-value of zero. The finding went into a draft report as evidence of manipulation. The same test, run on the company's salary table, its weekly order counts and its product price list, also returns a p-value of zero, and nobody manipulated those.
Benford's law is a real regularity and a useful screen. It is also the most over-applied result in data auditing, because the conditions under which it holds are specific and are rarely checked before the test is run.
What the Law Says
In many collections of numbers the leading digit is not uniform. A one appears about thirty percent of the time and a nine about five percent, following
The intuition is about scale. A quantity growing from 100 to 200 doubles, while growing from 900 to 1000 adds a ninth, so a process moving multiplicatively spends far longer with a leading one than with a leading nine. The distribution is the only one invariant under a change of units, which is why it turns up in physical constants, populations and payments alike.
1
2
3
4
5
6
7
8
9
10
11
12
13
14
15
16
17
18
19
20
21
22
23
24
25
26
27
28
29
30
31
import numpy as np
from scipy import stats

RNG = np.random.default_rng(29)
BENFORD = np.log10(1 + 1 / np.arange(1, 10))


def first_digit(v):
    v = np.abs(np.asarray(v, float))
    v = v[v > 0]
    return (v / 10 ** np.floor(np.log10(v))).astype(int)


def digit_shares(v):
    d = first_digit(v)
    return np.array([(d == k).mean() for k in range(1, 10)])


def mad(v):
    """Mean absolute deviation from Benford, the criterion auditors quote."""
    return np.abs(digit_shares(v) - BENFORD).mean()


def chi2_p(v):
    d = first_digit(v)
    obs = np.array([(d == k).sum() for k in range(1, 10)])
    return stats.chisquare(obs, BENFORD * obs.sum()).pvalue


for k, p in zip(range(1, 10), BENFORD):
    print(f"  leading digit {k}: {p:6.2%}")
| Leading digit | 1 | 2 | 3 | 4 | 5 | 6 | 7 | 8 | 9 |
|---|---|---|---|---|---|---|---|---|---|
| Expected share | 30.10% | 17.61% | 12.49% | 9.69% | 7.92% | 6.69% | 5.80% | 5.12% | 4.58% |
Which Legitimate Data Fails
1
2
3
4
5
6
7
8
9
10
11
12
r = np.random.default_rng(1)
cases = {
    "invoice amounts, wide spread": r.lognormal(6, 1.6, 20000),
    "invoice amounts, narrow spread": r.lognormal(6, 0.35, 20000),
    "salaries, 30k to 90k": r.uniform(30000, 90000, 20000),
    "order counts, 1 to 40": r.integers(1, 41, 20000).astype(float),
    "populations of towns": r.lognormal(8, 1.8, 20000),
    "prices ending in 99": np.round(r.lognormal(3, 0.9, 20000)) + 0.99,
}
for name, v in cases.items():
    print(f"{name:32s} MAD {mad(v):.4f}   chi-square p {chi2_p(v):7.4f}   "
          f"{'conforms' if mad(v) < 0.006 else 'does not conform'}")
| Column | Mean absolute deviation | Chi-square p | Verdict |
|---|---|---|---|
| Invoice amounts, wide spread | 0.0022 | 0.3492 | conforms |
| Invoice amounts, narrow spread | 0.0841 | 0.0000 | does not conform |
| Salaries, 30,000 to 90,000 | 0.1162 | 0.0000 | does not conform |
| Order counts, 1 to 40 | 0.0544 | 0.0000 | does not conform |
| Populations of towns | 0.0023 | 0.1260 | conforms |
| Prices ending in 99 | 0.0078 | 0.0000 | does not conform |
Four of those six columns are honest and fail the test. Salaries fail because they live inside a factor of three, so the leading digit is nearly determined by the range rather than by any multiplicative process. Order counts fail for the same reason. Prices fail because a pricing convention overrides the arithmetic. Only the two columns spanning several orders of magnitude conform.
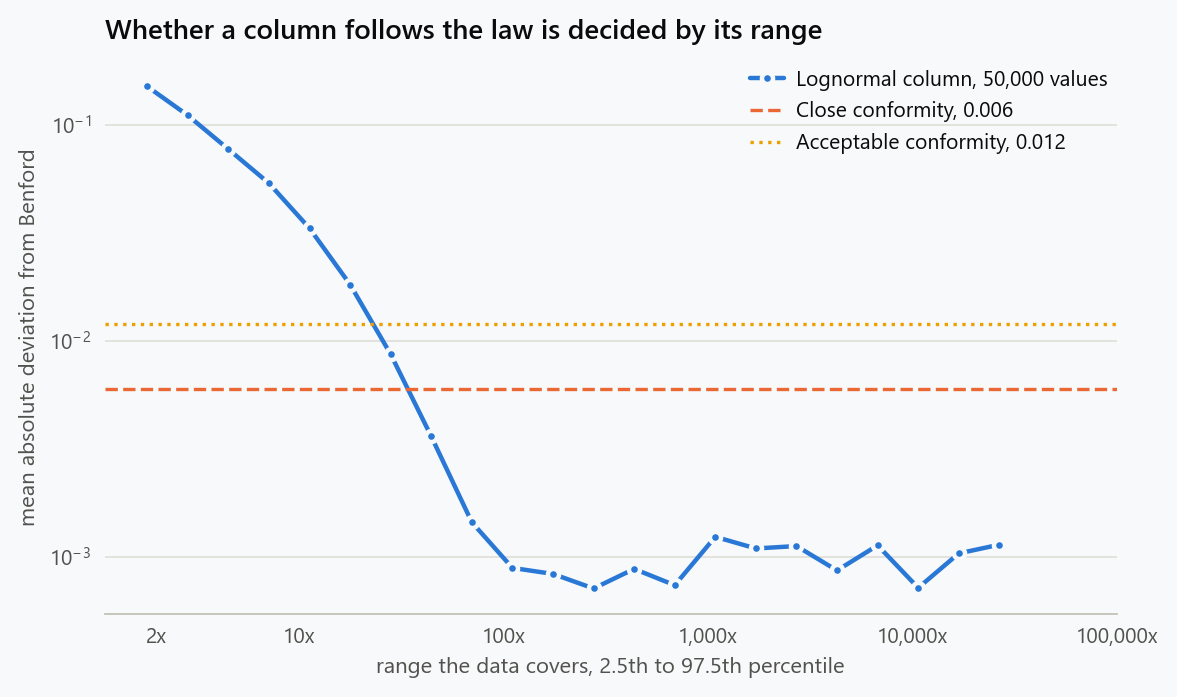
The controlling quantity is the spread, and it can be measured before running the test.
1
2
3
4
for sigma in (0.2, 0.4, 0.8, 1.2, 1.6, 2.4):
    v = np.random.default_rng(2).lognormal(6, sigma, 50000)
    print(f"lognormal sigma {sigma:4.1f} (spans {10 ** (2 * 1.96 * sigma / np.log(10)):8.0f}x): "
          f"MAD {mad(v):.4f}, chi-square p {chi2_p(v):7.4f}")
| Spread of the data | Ratio between the 2.5th and 97.5th percentiles | Mean absolute deviation | Chi-square p |
|---|---|---|---|
| 0.2 | 2x | 0.1348 | 0.0000 |
| 0.4 | 5x | 0.0738 | 0.0000 |
| 0.8 | 23x | 0.0131 | 0.0000 |
| 1.2 | 110x | 0.0015 | 0.2000 |
| 1.6 | 530x | 0.0013 | 0.1164 |
| 2.4 | 12,185x | 0.0009 | 0.6965 |
Nothing is wrong with any of these columns. They differ only in how many orders of magnitude they cover, and conformity arrives somewhere between a thirtyfold and a fortyfold spread. A column whose values fall within a factor of twenty or thirty should not be tested at all, because the answer is known in advance and it is not about fraud.
How Much Fabrication It Catches
The screen exists to find invented numbers. Two kinds are worth separating: entries a person made up digit by digit, which come out roughly even across digits, and entries placed deliberately below an approval limit, which pile onto one or two digits.
1
2
3
4
5
6
7
8
9
10
11
12
13
14
15
16
17
18
19
20
21
22
def fabricate(n, share, kind, rng):
    """A share of the entries are invented by a person rather than generated
    by the process: either digits spread evenly, or amounts just under a
    reporting threshold."""
    real = rng.lognormal(6, 1.6, n)
    if kind == "even digits":
        fake = rng.uniform(1, 10, n) * 10 ** rng.integers(2, 6, n)
    else:
        fake = rng.uniform(4200, 4999, n)      # just under a 5,000 sign-off limit
    take = rng.random(n) < share
    return np.where(take, fake, real)


for kind in ("even digits", "just under a limit"):
    for share in (0.02, 0.05, 0.10, 0.25):
        hits = 0
        r = np.random.default_rng(7)
        for _ in range(400):
            v = fabricate(2000, share, kind, r)
            hits += chi2_p(v) < 0.05
        print(f"{kind:20s} {share:4.0%} of rows fabricated, 2,000 rows: "
              f"flagged {hits / 400:5.1%} of the time")
| Kind of fabrication | 2% of rows | 5% | 10% | 25% |
|---|---|---|---|---|
| Digits spread evenly | 5.2% | 16.0% | 51.5% | 100.0% |
| Amounts just under a limit | 48.0% | 100.0% | 100.0% | 100.0% |
The two rows are the practical summary of the method. Amounts pushed just below a sign-off limit are caught at two percent contamination, because they concentrate on a single leading digit and the law notices. Numbers invented freely are almost invisible until a tenth of the file is fake, since spreading digits evenly across a file that is mostly genuine barely shifts the totals.
Sample size decides the rest.
1
2
3
4
5
6
7
8
9
10
11
12
13
for n in (200, 500, 2000, 10000):
    hits = 0
    r = np.random.default_rng(11)
    for _ in range(400):
        v = fabricate(n, 0.05, "even digits", r)
        hits += chi2_p(v) < 0.05
    clean = 0
    rc = np.random.default_rng(12)
    for _ in range(400):
        v = rc.lognormal(6, 1.6, n)
        clean += chi2_p(v) < 0.05
    print(f"{n:6d} rows: flags 5% fabrication {hits / 400:5.1%} of the time, "
          f"flags clean data {clean / 400:5.1%} of the time")
| Rows tested | Flags 5% fabrication | Flags clean data |
|---|---|---|
| 200 | 7.8% | 5.8% |
| 500 | 6.8% | 6.2% |
| 2,000 | 14.2% | 4.8% |
| 10,000 | 62.7% | 4.5% |
At two hundred rows the test is barely distinguishable from a coin weighted at one in twenty, which is its false alarm rate. It becomes useful in the thousands. That is the opposite of how the screen is usually deployed, on a small extract someone suspected in the first place.
Why the Test Breaks on Large Tables
The row above hints at the other failure. A chi-square test detects any deviation given enough rows, and real data always deviates a little: prices have conventions, amounts round, systems cap values. On a million-row table the test rejects conformity for reasons that have nothing to do with anyone's conduct.
This is why audit practice quotes the mean absolute deviation rather than a p-value. It measures how far the digits sit from the law rather than how confident we are that they are not exactly on it, and its conventional thresholds do not tighten as the table grows. In the spread table above, a column at 0.8 has a p-value of zero and a deviation of 0.0131, which is the honest reading: clearly not Benford, and clearly not by much.
Better Questions Than the First Digit
The first digit is the weakest of the digit checks, because it carries the least information and the most legitimate variation. Two others are usually more informative.
1
2
3
4
5
6
7
8
9
10
11
12
13
14
15
16
17
18
19
def second_digit_p(v):
    v = np.abs(np.asarray(v, float))
    v = v[v >= 10]
    scaled = v / 10 ** (np.floor(np.log10(v)) - 1)
    d = (scaled.astype(int) % 10)
    expected = np.array([sum(np.log10(1 + 1 / (10 * k + j)) for k in range(1, 10))
                         for j in range(10)])
    obs = np.array([(d == j).sum() for j in range(10)])
    return stats.chisquare(obs, expected / expected.sum() * obs.sum()).pvalue


r = np.random.default_rng(13)
clean = r.lognormal(6, 1.6, 20000)
rounded = np.where(r.random(20000) < 0.35, np.round(clean, -2), clean)
print(f"clean data:   first digit p {chi2_p(clean):7.4f}, second digit p {second_digit_p(clean):7.4f}")
print(f"35% rounded to the nearest 100: first digit p {chi2_p(rounded):7.4f}, "
      f"second digit p {second_digit_p(rounded):7.4f}")
print(f"share of rounded data ending in 00: {np.mean(np.isclose(rounded % 100, 0)):5.1%} "
      f"against {np.mean(np.isclose(clean % 100, 0)):5.1%} in clean data")
| Column | First digit p | Second digit p | Share ending in 00 |
|---|---|---|---|
| Clean | 0.2361 | 0.5694 | 0.0% |
| 35% rounded to the nearest hundred | 0.0000 | 0.0000 | 34.8% |
The terminal-digit check is the one that names the problem. A third of the values ending in double zero against essentially none in clean data is not a subtle statistical signal, it is a description of what happened: someone or something rounded. That points at a data-entry practice or a system integration, which is usually the true explanation, and it does so without implying misconduct.
What the Result Is Worth
A failed Benford test is a reason to look, never a finding in itself. The realistic list of explanations, in rough order of likelihood, is: the column does not span enough orders of magnitude, the values follow a pricing or rounding convention, the data is an aggregate of several processes, a system cap or floor truncates the range, and last, someone invented numbers. An audit that reports the fifth without excluding the first four has not done the work.
Used the other way round, the screen is genuinely valuable. Run it on a column that should conform, across time or across suppliers, and compare the deviation between groups rather than against the law in absolute terms. A single supplier whose invoices deviate while the other two hundred conform is a real signal, and it does not depend on whether the law strictly applies to the column.
What to Do
- Check the spread before testing. A column covering less than about one and a half orders of magnitude will fail regardless of its honesty, and the test says nothing.
- Exclude assigned numbers outright. Identifiers, phone numbers, dates and anything drawn from a fixed range are not generated by a multiplicative process.
- Quote the mean absolute deviation, not a p-value, on tables of any size. The p-value becomes a measure of sample size rather than of conformity.
- Compare groups rather than testing against the law alone. Deviation that is unusual among suppliers, months or entry clerks is far stronger evidence than deviation against a theoretical curve.
- Follow a first-digit flag with terminal-digit and second-digit checks. They separate rounding and data-entry conventions, which are common, from fabrication, which is rare.
- Treat any flag as a question for the process owner. Most failures have a dull explanation, and finding it is cheaper than defending an accusation.
The figure generator in the blog-reproducibility repository reproduces this article's figure; run it with --dry-run to print the numbers behind the figure without writing an image.
References
- Benford, F. (1938). The law of anomalous numbers. Proceedings of the American Philosophical Society, 78(4), 551-572.
- Hill, T. P. (1995). A statistical derivation of the significant-digit law. Statistical Science, 10(4), 354-363.
- Nigrini, M. J. (2012). Benford's Law: Applications for Forensic Accounting, Auditing, and Fraud Detection. Wiley.
- Nigrini, M. J., & Mittermaier, L. J. (1997). The use of Benford's law as an aid in analytical procedures. Auditing: A Journal of Practice and Theory, 16(2), 52-67.
- Durtschi, C., Hillison, W., & Pacini, C. (2004). The effective use of Benford's law to assist in detecting fraud in accounting data. Journal of Forensic Accounting, 5(1), 17-34.
- Cho, W. K. T., & Gaines, B. J. (2007). Breaking the (Benford) law: statistical fraud detection in campaign finance. The American Statistician, 61(3), 218-223.
Embed interactive plots, widgets, and demos using <figure>, <iframe>, or <div class="interactive-embed"> containers. Ensure each embed includes descriptive captions for accessibility.
How to cite
Use the quick export buttons to save citations for reference managers or copy the formatted text directly.
Diogo Ribeiro (2025). Benford's Law: A Screening Tool That Accuses the Innocent. Faculty of Media Arts and Design, Technical University of Porto. https://diogoribeiro7.github.io/statistics/benfords_law_screening_not_proof/.

