Topics
Suppose a fair coin produces four heads in a row. If each toss is independent, the chance of heads next is still 50%. The previous results have not created a debt that the next toss must repay.
That is the mistake behind saying that tails is now “due.” A short sequence is being asked to enforce a balance that the probability model never promised.
But there is a second mistake to avoid: assuming that previous observations can never matter in a random process. Sometimes they change what remains in the system. Sometimes they change what we know about it.
We can separate those cases by giving the same four-head streak to three different mechanisms.
First mechanism: a known fair, independent coin
In this model, every toss has probability one-half of heads, regardless of the previous outcomes. “Independent” is doing essential work here.
Before any tosses, the probability of four initial heads is
That is 6.25%. Once those four heads have happened, however, we are asking a new question: what comes next?
Both five-heads and four-heads-then-tails sequences had probability $1/32$ in advance. Conditional on the first four results being heads, they remain equally likely alternatives for the fifth result.
The distinction is between the probability of the entire sequence before observing it and the probability of the remaining outcome after part of it is known.
For repeated independent trials with a fixed success probability, the binomial model describes the total number of successes. It does not require each small block of trials to contain the same number of each outcome. NIST's binomial distribution reference.
Balance can improve without a compensating streak
Imagine that the next 100 tosses after those four heads contain 50 heads and 50 tails. Across all 104 tosses, there would then be 54 heads and 50 tails.
The four-head excess has not been erased. Yet the fraction of heads has moved from 100% to about 51.9%, simply because the original imbalance is now a smaller part of a longer record.
Exactly 50 heads in the next 100 tosses is an illustration, not a prediction. The expected number is 50, with variation around it.
This explains why a long-run tendency toward a proportion does not require short-run correction. A fixed early imbalance can become less important as the denominator grows. The coin does not need to increase the probability of tails to achieve that.
Second mechanism: a bag whose contents change
Now replace the coin with ten tokens in a bag: five marked H and five marked T. Draw uniformly at random and do not put a token back.
Suppose the first four tokens are all H. The bag now contains one H and five T tokens. The next probability of H is therefore
Here the previous observations matter because drawing tokens changes the available population. The mechanism contains a finite stock with a fixed composition at the start.
T is now more likely, but that conclusion comes from counting the remaining tokens. It does not follow from a general rule that random outcomes must reverse after a streak.
If every drawn token were replaced and the bag mixed again, the H probability would return to one-half. Changing that one procedure changes the relevant probability model.
Third mechanism: a coin whose bias is unknown
Consider a different experiment. Someone randomly chooses one of two coins, with equal probability:
- Coin L produces heads with probability 25%.
- Coin H produces heads with probability 75%.
The selected coin is then tossed repeatedly. Tosses are independent given which coin was selected. We do not know its identity.
Before seeing any results, the probability of heads is 50%, because the two possible biases average to one-half.
After four initial heads, the evidence favours Coin H. That sequence is $0.75^4/0.25^4=81$ times as likely under Coin H as under Coin L. With equal starting probabilities, the updated probabilities for the coin's identity are $81/82$ and $1/82$.
The chance of heads next becomes
The physical coin has not changed. Our information about it has. The streak shifts the prediction toward more heads, rather than toward a compensating tail.
This is a deliberately specified uncertainty model. It does not mean that four heads from an ordinary coin establish a 74.4% probability for its next toss.
Put the three answers side by side
| After four initial H outcomes | Probability of H next | What makes history relevant? |
|---|---|---|
| Known fair, independent coin | 50.0% | Nothing changes in the specified mechanism |
| Five-H, five-T bag without replacement | 16.7% | The remaining contents have changed |
| Unknown 25%- or 75%-heads coin | 74.4% | We have learned about the coin's identity |
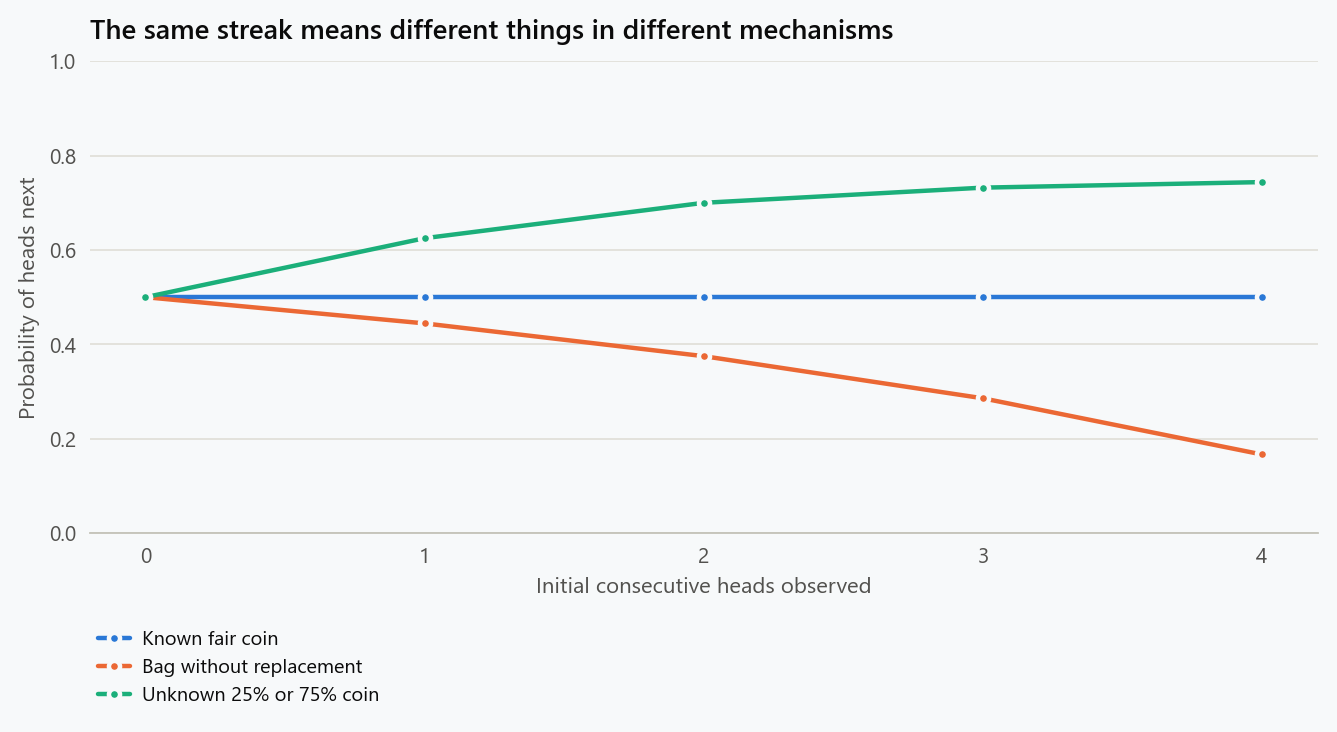
Original exact calculation. The bag starts with five H and five T tokens. The unknown coin is selected once, with equal prior probability of a 25% or 75% heads rate.
The visible history is the same. The answers differ because the mechanisms differ.
This is why a streak in a sports team, a sequence of rainy days, or repeated manufacturing failures cannot be settled by announcing that a fair coin has no memory. Those situations require evidence about their own processes. An independent-coin argument does not establish independence in a different system.
Four heads at the start is not four heads somewhere
The probability $1/16$ concerned four positions specified before looking at the outcomes. A video showing an impressive section of a longer record answers a different question: what is the chance that some section contains four consecutive heads?
In 100 tosses there are 97 possible starting positions for a four-toss window. Each window has probability $1/16$ of being all heads under the independent fair-coin model. The expected number of all-head windows is therefore $97/16\approx6.06$.
That expected count is not a probability. It can exceed one because a record can contain several qualifying windows. Nor can we treat the 97 windows as independent trials: a run of five heads produces two overlapping four-head windows, and a run of six produces three.
An exact calculation must handle that overlap. Keep track of how many consecutive heads currently end the sequence, but only for sequences that have not yet reached four. The possible retained states are zero, one, two, or three trailing heads.
A tail sends any retained state back to zero. A head advances it by one. A head after state three completes the target run, so that probability leaves the collection of sequences still avoiding it. Repeating this update gives:
| Number of fair, independent tosses searched | Probability of at least one run of four heads |
|---|---|
| 4 | 6.25% |
| 20 | 47.80% |
| 50 | 82.74% |
| 100 | 97.27% |
Finding four heads somewhere in 100 tosses is ordinary under this model. The rare-looking clip can be real while the conclusion that the process must be nonrandom is unsupported.
The table is specifically about a run of heads. Searching for four identical outcomes of either kind, trying several run lengths, or searching many separate recordings creates additional opportunities. A probability calculation must match the search that was actually performed.
This distinction appears far beyond coins. A striking cluster selected from many maps, time periods, or accounts has a different evidential meaning from a cluster in a region and interval specified in advance. The wider search does not make the observation false. It changes the reference experiment needed to assess how surprising it is.
Seeing a pattern is different from testing a pattern
Every particular eight-toss sequence has probability $1/256$ under the fair independent model. HHHHHHHH, HTHTHTHT, and HHTHTTHT have the same probability when each exact sequence is specified beforehand.
That does not mean all pattern categories are equally frequent. “Exactly this sequence” describes one outcome. “Any sequence containing four consecutive heads” describes a collection of outcomes. “Any sequence I would consider striking after seeing it” is a much less clearly specified collection.
Confusion arises when a viewer moves between these descriptions. The observed exact sequence was individually unlikely, but so was every alternative exact sequence. To test whether a mechanism is plausible, we need a feature that distinguishes its predictions from those of a competing explanation, together with a sampling and selection rule.
For example, if a machine is supposed to produce independent binary outputs with equal probabilities, a test might examine an explicitly defined excess of long runs across a prespecified record. If a different mechanism produces strong serial dependence, that feature can help distinguish the models. Merely announcing the probability of the one realised sequence is insufficient.
A test also has to allow for parameter estimation. If the machine's overall proportion of ones was estimated from the same record, an analysis treating that proportion as known in advance can misstate uncertainty. The assumptions about what was fixed, what was learned, and what was searched should be visible.
A process can look fair one toss at a time and still be dependent
Return to the unknown coin selected once from biases 25% and 75%. Before observing anything, each toss separately has a 50% chance of heads. Yet the tosses are not independent when the coin's identity is unknown.
The probability that the first two tosses are both heads is
If the tosses were independent with marginal heads probability one-half, that probability would instead be $0.5\times0.5=0.25$. The same hidden coin affects both outcomes, making matching outcomes more likely in the mixture than the marginal probabilities alone suggest.
For an indicator that is one for heads and zero for tails, the covariance between two distinct tosses is $0.3125-0.25=0.0625$. Each indicator has variance 0.25, so their marginal correlation is 0.25. Once the coin's identity is specified, however, the model makes the tosses independent. Dependence can appear when we average over an unknown shared feature.
This also changes the long-run interpretation. In a single long experiment, the heads fraction tends towards the selected coin's bias, either 25% or 75%, under the conditional independent-toss model. Across experiments that select new coins with equal probability, the average fraction is 50%. Those two averages refer to different repetitions of the experiment.
The example warns against inferring independence from a balanced aggregate percentage. A dataset can contain equal proportions overall while observations within the same person, machine, location, or episode share an unobserved condition. Whether that happens in a real setting is an empirical question; the coin mixture provides a mechanism showing how it can happen.
Update the uncertain model when the streak ends
Learning does not stop at the fourth head. In our two-coin model, each head multiplies the odds for the 75% coin over the 25% coin by three. Each tail multiplies those odds by one-third.
After $h$ heads and $t$ tails, the likelihood ratio for the coin identities is
With equal prior odds, four heads give odds of 81 to one. A subsequent tail reduces them to 27 to one; it does not erase the four previous observations. The next-head probability becomes
After four heads and four tails, the evidence for the two candidate identities balances again. In this model only the counts matter for identifying the coin, because each candidate assumes conditional independence. If the competing mechanisms differed in how outcomes depend on their predecessors, the order could matter too.
This is the same general reasoning used in the climate example introducing KL divergence: observations contribute likelihood ratios, and their logarithms add under the appropriate independence assumptions. Evidence can accumulate while individual observations push in opposite directions. Neither a reversal nor a continuation is automatically proof of the model we prefer.
A better question than “is a reversal due?”
Ask what would make the next probability change. Has the pool of possible outcomes changed? Has the process itself changed? Have the observations taught us something about an unknown feature?
If the answer is none of those, and the trials really are independent with known probabilities, a recent imbalance does not create a correction mechanism.
If the answer is yes, use that mechanism to calculate or estimate the next probability. The bag and unknown-coin examples show why merely labelling a process random is insufficient.
Reproduce the comparison
1
2
3
4
5
6
7
8
for heads in range(5):
    fair = 0.5
    bag = (5 - heads) / (10 - heads)
    unknown = (0.25**(heads + 1) + 0.75**(heads + 1)) / (
        0.25**heads + 0.75**heads
    )
    print(f"{heads} initial heads: fair={fair:.1%}, "
          f"bag={bag:.1%}, unknown={unknown:.1%}")
The run-search calculation needs only four retained states:
1
2
3
4
5
6
7
8
9
def probability_of_four_heads(tosses):
    # Probability mass still avoiding four heads, by trailing head count.
    states = [1.0, 0.0, 0.0, 0.0]
    for _ in range(tosses):
        states = [0.5 * sum(states)] + [0.5 * p for p in states[:-1]]
    return 1 - sum(states)

for tosses in (4, 20, 50, 100):
    print(tosses, f"{probability_of_four_heads(tosses):.2%}")
The figure generator reproduces the chart and run probabilities. Its unknown-coin probabilities and short-record run probabilities are checked independently by enumerating the possible sequences.
Archive note: dated 9 October 2025 for this collection; written and source-checked on 18 September 2026.
Embed interactive plots, widgets, and demos using <figure>, <iframe>, or <div class="interactive-embed"> containers. Ensure each embed includes descriptive captions for accessibility.
How to cite
Use the quick export buttons to save citations for reference managers or copy the formatted text directly.
Diogo Ribeiro (2025). Randomness Does Not Owe Us a Reversal. Faculty of Media Arts and Design, Technical University of Porto. https://diogoribeiro7.github.io/science-communication/randomness_does_not_owe_a_reversal/.