Topics
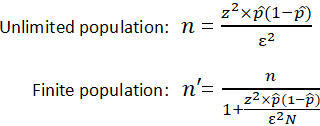
Sample size is not a universal measure of study quality. More observations can reduce sampling variability, but they do not repair biased measurement, selection bias, confounding, leakage, or a badly defined estimand. A very large sample can estimate the wrong quantity with great precision.
The useful question is therefore not "How large should the sample be?" in isolation. It is "How much information is required for this estimand under this design and decision criterion?"
Precision and the square-root law
For many simple estimators, standard error decreases approximately as
This means diminishing returns. To cut a standard error in half, one often needs roughly four times as many independent observations.
For a mean with standard deviation $\sigma$,
If the goal is an interval with half-width $h$, a normal approximation gives roughly
This is a precision calculation, not a power calculation.
Power depends on an alternative
Power is the probability of rejecting the null under a specified alternative:
A sample-size calculation therefore needs an effect size or alternative hypothesis. Asking for 80% or 90% power without specifying the effect to be detected is incomplete.
For a simple two-group mean comparison with common variance, the required sample size depends on the standardized effect
along with alpha, desired power, allocation ratio, and test specification.
Minimum detectable effect
Sometimes the design starts from a fixed budget or feasible sample size. Then the more honest question is the minimum detectable effect rather than pretending the sample can be chosen freely.
A minimum detectable effect should be interpreted substantively. A study can have enough power to detect a tiny effect that has no practical relevance, or too little power to detect the smallest effect that would actually change a decision.
Larger samples make trivial effects significant
With sufficiently large n, very small deviations from a null model can produce small p-values. Statistical significance therefore becomes easier as sample size increases.
This is not a defect of hypothesis testing; it is a reminder to report effect sizes and uncertainty. Practical importance is a scientific or decision question, not a p-value threshold.
Dependence reduces effective information
One thousand independent observations and one thousand highly correlated observations do not contain the same information.
For clustered data, a common approximation uses the design effect
where m is average cluster size and $\rho$ the intraclass correlation. The effective sample size is then roughly
Repeated measures, households, hospitals, schools, devices, and spatial units all require attention to dependence.
Attrition and missing data
Planned sample size should account for expected loss to follow-up, but merely inflating n does not solve informative missingness.
If dropout depends on prognosis, treatment response, or unobserved outcomes, the missingness mechanism can bias estimates. The design should include retention strategies and a principled analysis plan, not only an attrition multiplier.
Multiple outcomes and subgroup analyses
If a study has several primary outcomes, many treatment arms, or planned subgroup analyses, the sample-size problem changes. Multiplicity can reduce power after error-rate control, while interaction effects often require much larger samples than main effects.
A design powered for an overall treatment effect may be severely underpowered for heterogeneity of treatment effect.
Prediction models have different requirements
Sample-size planning for prediction is not the same as planning a two-sample test. Relevant quantities include outcome prevalence, number of candidate parameters, expected signal strength, shrinkage, calibration, and the intended validation strategy.
Rules such as "ten events per variable" are too crude to serve as universal design criteria. Modern prediction-model planning should be based on expected model complexity and target performance rather than a single heuristic.
External validity is not bought with n
A huge convenience sample can be less informative about a target population than a smaller probability sample. Representativeness depends on sampling design and transportability assumptions.
If the sample excludes important subpopulations, increasing n within the same biased frame only estimates the restricted population more precisely.
Simulation is often the right tool
When the design includes clustering, censoring, nonlinearity, adaptive rules, complex estimators, or several endpoints, analytic formulas can become unreliable or unavailable.
A simulation-based design can generate data under plausible parameter values, apply the planned analysis, and estimate operating characteristics such as power, bias, interval width, and coverage.
Conclusion
Sample size should follow from the inferential target. The central ingredients are effect size, precision, alpha, power, dependence, missingness, model complexity, multiplicity, and the intended decision.
More data are useful when they add relevant information. They are not a substitute for good measurement or good design.
References
- Cohen, J. (1988). Statistical Power Analysis for the Behavioral Sciences.
- Lakens, D. (2022). Sample Size Justification.
- Riley, R. D., et al. (2020). Calculating the sample size required for developing a clinical prediction model.
- van Belle, G. (2008). Statistical Rules of Thumb.
Embed interactive plots, widgets, and demos using <figure>, <iframe>, or <div class="interactive-embed"> containers. Ensure each embed includes descriptive captions for accessibility.
How to cite
Use the quick export buttons to save citations for reference managers or copy the formatted text directly.
Diogo Ribeiro (2023). Sample Size: Power, Precision, and Design. Faculty of Media Arts and Design, Technical University of Porto. https://diogoribeiro7.github.io/statistics/sample_size/.

