Topics
The scientific method is often taught as a short sequence: ask a question, state a hypothesis, collect data and draw a conclusion. That sequence is useful as an introduction, but it hides the part of science that matters most for interpretation: a study is only informative to the extent that its design, measurements and analysis correspond to the question being asked.
A prevalence survey, a cohort study, a case-control study, a randomised trial, a diagnostic study, a mechanistic experiment and a meta-analysis are not interchangeable attempts to answer one generic scientific question. They target different quantities under different assumptions. The familiar evidence pyramid is therefore only conditionally useful. For some intervention questions, randomisation gives a particularly strong route to causal identification. For other questions, such as prevalence, prognosis, mechanism, implementation or diagnostic accuracy, the relevant hierarchy changes because the estimand changes.
A more useful abstraction is
where $Q$ is the scientific question, $E$ the estimand, $P$ the target population, $D$ the design, $M$ the measurement process, $A$ the analysis, $I$ the interpretation, and $R$ replication, criticism and revision.
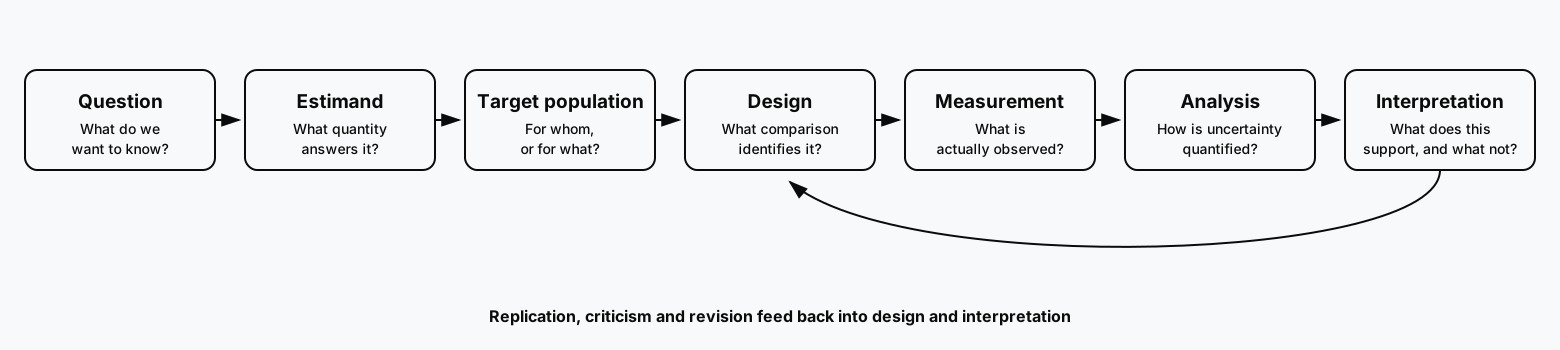
The order matters. If the estimand is vague, statistical sophistication cannot repair the question later. If the measurement does not represent the target construct, a larger sample estimates the wrong quantity more precisely. If the design does not identify the causal contrast being claimed, modelling may obscure the problem rather than solve it. Good scientific practice is therefore not the accumulation of methodological labels. It is the disciplined matching of a scientific claim to the conditions that make that claim defensible.
From question to estimand
Before asking whether a study is randomised or observational, ask what quantity the investigators want to know. A prevalence question may target
a prediction problem may target
a diagnostic problem may target a post-test probability such as
a causal question may target an average treatment effect,
and a survival problem may target a time-to-event distribution,
These are not alternative ways of expressing the same target. They are different estimands. The design should be judged by whether it can estimate or identify the one that matters.
That point immediately explains why a universal ranking of study designs is misleading. Suppose the question is how common a disease is in a population. A carefully sampled cross-sectional survey can estimate prevalence directly. Randomising participants to treatment and control does not improve that estimate because it answers a different question. For descriptive inference, the central threats are representativeness, non-response, measurement error, the sampling frame and the weighting scheme. A huge convenience sample can therefore be less informative than a smaller probability sample.
The same principle applies to cross-sectional and ecological studies. A cross-sectional design can estimate prevalence and contemporaneous associations, but when exposure and outcome are measured at roughly the same time, temporal direction is often unresolved. If physical activity and depression are negatively associated, the data may be compatible with activity affecting depression, depression affecting activity, or a third variable affecting both. The association itself can be well estimated while the causal direction remains unidentified.
Ecological studies move the unit of analysis to groups such as countries, hospitals, schools or regions. A relationship between average income and mortality across countries is a group-level relationship. It does not imply that the same relationship holds among individuals within countries. The ecological fallacy is not an argument against ecological analysis. It is an argument against silently changing the level at which the conclusion is stated.
Case reports and case series sit at yet another part of the inferential landscape. They are usually weak for comparative treatment effects because there is no counterfactual comparison group, but they can be strong for documenting that an event occurred. Rare adverse events, unusual disease presentations and unexpected treatment responses are often first detected this way. The correct conclusion may simply be that a phenomenon exists and deserves further investigation.
Observational designs, causal questions and randomisation
Case-control and cohort studies differ most usefully in how their data are sampled and organised, not in simplistic slogans about which variable "comes first." A case-control study samples cases and controls and reconstructs exposure histories. Its efficiency for rare outcomes comes from conditioning the sample on outcome status rather than waiting for enough rare events to accumulate prospectively. A common estimand is the odds ratio,
Its validity depends critically on control selection, exposure ascertainment, recall, measurement and confounding. The controls should represent the exposure distribution in the source population that generated the cases.
A cohort design follows or reconstructs groups defined by exposure or other baseline characteristics and can estimate risks, rates, risk differences, risk ratios and time-to-event quantities. For example,
The temporal ordering is usually clearer than in a cross-sectional design, but causal interpretation still depends on comparability between exposed and unexposed groups. If
then an association between $X$ and $Y$ can arise even when $X$ has no causal effect. Adjustment can reduce confounding when the relevant variables are measured well and modelled appropriately. It cannot recover information about important confounders that were never observed.
Randomisation addresses this problem in a particular way. For an intervention, let $Y_i(1)$ and $Y_i(0)$ denote the potential outcomes under treatment and control. The average treatment effect is
Both potential outcomes cannot be observed for the same individual, so causal inference requires a comparison across units. Random assignment creates groups that are comparable in expectation before treatment and, when implemented properly, breaks systematic dependence between treatment assignment and baseline causes of the outcome. This is why randomised controlled trials are particularly powerful for many intervention effects.
Randomisation, however, is not a certificate of validity. Allocation concealment protects the assignment process before treatment by preventing the next allocation from being predicted or manipulated. Blinding operates after assignment by reducing behavioural and measurement effects among participants, clinicians, outcome assessors or analysts. Attrition, protocol deviations, invalid outcome measurement and undisclosed outcome switching can still compromise a trial after an otherwise sound randomisation procedure.
Nor can every causal question be randomised. Harmful long-term exposures, childhood socioeconomic conditions, environmental disasters, genetic variants and many policy interventions cannot be assigned experimentally. Observational causal inference is therefore indispensable. Designs such as regression discontinuity, interrupted time series, natural experiments, instrumental-variable strategies, difference-in-differences and target-trial emulation attempt to identify causal contrasts using structure in how exposure or treatment occurs.
The right question is not merely whether a study is observational. It is what source of variation identifies the causal contrast and which assumptions make that comparison credible. A regression discontinuity design, for example, may compare observations immediately around an eligibility threshold $c$ and target a local effect such as
Such an effect may be internally well identified near the threshold while transporting poorly to observations far from it. Internal identification and external validity are separate properties.
Prediction, diagnosis, mechanism and qualitative evidence
Prediction and causation are often confused because both use covariates and outcomes. A prognostic model may target
and can predict future outcomes well without identifying any causal effect of the predictors. Calibration, discrimination, overfitting control, predictor measurement, external validation and transportability therefore matter more than causal identification unless the scientific question is explicitly causal. TRIPOD+AI now provides the current reporting framework for clinical prediction models using regression or machine-learning methods, superseding the original 2015 TRIPOD checklist.
Diagnostic accuracy studies target yet another set of quantities. If a test $T$ is compared with a reference standard for disease $D$, sensitivity is
specificity is
and positive predictive value is
Predictive values depend on prevalence. A diagnostic study can therefore be excellent science while saying nothing about whether treating patients on the basis of the test improves outcomes. STARD addresses the reporting of diagnostic accuracy studies because the relevant biases differ from those in intervention trials.
Mechanistic experiments ask how a process operates. Molecular, cellular, organ, animal and computational studies can establish that a pathway exists, identify intermediate processes and constrain causal explanations. Their inferential difficulty is often translation. An effect observed in vitro does not automatically establish a clinically meaningful effect in vivo, because dose, exposure, compensatory pathways and competing mechanisms may differ. Animal research raises the same distinction between experimental quality and transportability to humans. ARRIVE provides reporting guidance for animal studies, but transparent reporting does not remove the biological question of translation.
Qualitative research occupies a different region of the scientific map. Questions about experience, implementation, meaning, organisational behaviour and decision processes cannot always be reduced to an average treatment effect. Interviews, focus groups, ethnography and related methods can reveal mechanisms of implementation and context that quantitative designs may miss. Sampling strategy, reflexivity, coding, saturation and context become central, and reporting frameworks such as COREQ and SRQR make those methodological choices visible. The correct comparison is not whether qualitative evidence is "below" quantitative evidence. It is whether the method answers the question being asked.
N-of-1 trials illustrate the same principle at the individual level. Repeatedly alternating treatments within one person can be powerful when effects are reversible, outcomes can be measured repeatedly and carryover can be controlled. It is inappropriate for irreversible treatments and many one-time outcomes. Again, the design is useful because it matches a particular estimand.
A compact question-by-design map is therefore more useful than a universal ranking:
| Scientific question | Typical useful designs | Main threat |
|---|---|---|
| How common is it? | Cross-sectional survey, registry | Selection and measurement bias |
| What predicts it? | Cohort, prediction study | Overfitting, calibration, transportability |
| What caused it? | RCT, quasi-experiment, causal observational design | Confounding, missing data, implementation failure |
| What preceded a rare outcome? | Case-control | Control selection, recall and exposure misclassification |
| Does a mechanism exist? | Laboratory, mechanistic, animal study | Translation and dose relevance |
| How accurate is a test? | Diagnostic accuracy study | Spectrum bias and reference standard |
| What is the experience or implementation problem? | Qualitative study | Sampling, reflexivity and context |
| What does the literature show? | Systematic review, evidence synthesis | Search, study bias and heterogeneity |
The table is a map, not a ladder.
Evidence synthesis is another design problem
A systematic review is itself a research design. It begins with a defined question and an explicit procedure for finding, selecting and evaluating relevant studies. In simplified form,
The word systematic refers to the explicitness and reproducibility of that process. A narrative review can be excellent scholarship, but its source selection is usually less formalised and omissions are therefore harder to audit. PRISMA 2020 improves the transparency of systematic-review reporting, but a PRISMA flow diagram does not guarantee a sound review. It makes the selection process visible.
A systematic review does not require a meta-analysis. If the included studies differ fundamentally in population, intervention, outcome definition, design, follow-up or effect measure, statistical pooling may produce a precise answer to a question the studies do not actually share. Deciding not to pool can therefore be the correct scientific conclusion.
When pooling is appropriate, meta-analysis formalises how quantitative evidence is combined. Suppose study $i$ estimates an effect $\hat\theta_i$ with standard error $s_i$. Under a simple common-effect formulation, inverse-variance weights are
and the pooled estimate is
More precise studies receive more weight. That can improve precision, but it cannot remove bias within the studies being combined.
Under a conventional normal-normal random-effects formulation, study-specific effects may be modelled as
where $\tau^2$ represents between-study heterogeneity. A common inverse-variance form then uses
with pooled mean
This is one important random-effects formulation, not the definition of random-effects meta-analysis itself. More importantly, the pooled mean is not the whole scientific result. If effects vary substantially across settings, a prediction interval can be more informative because it asks where the effect in a new comparable study might plausibly fall. Current Cochrane guidance therefore treats heterogeneity as substantive information to be understood, not merely as an inconvenience to be averaged away.
That distinction matters because a narrow pooled confidence interval can coexist with poor validity. If ten studies share the same bias, a meta-analysis can estimate that bias with remarkable precision. Publication bias introduces another layer of selection if
Even a perfectly executed search of the published literature cannot recover studies that were never published. Registration, protocols, preprints and regulatory records reduce this opacity but do not eliminate it.
Network meta-analysis, umbrella reviews and scoping reviews likewise answer different questions. Network meta-analysis adds indirect comparisons under assumptions such as transitivity. Umbrella reviews synthesise systematic reviews and must handle overlap and differences in review quality. Scoping reviews map concepts, methods and gaps rather than necessarily estimating a pooled effect. Judging all three by whether they produce one summary number is another version of the same mistake: confusing a method's output with its scientific purpose.
Good practice constrains different sources of error
Many research failures are determined before the first observation is recorded. Protocols, prespecified outcomes, sample-size arguments, missing-data plans and analysis plans are therefore part of design rather than administrative extras. SPIRIT 2025 addresses trial protocols; CONSORT 2025 addresses completed randomised trials. Their role is to expose what was planned, what was changed and what was observed.
Preregistration is useful because it distinguishes confirmatory from exploratory analysis. Exploration is essential to science. The problem is not discovering an unexpected pattern after seeing the data; it is presenting that discovery as though it had been predicted in advance. A poor analysis plan can be preregistered perfectly, so preregistration does not guarantee quality. Its contribution is provenance.
Sample size should also follow the estimand and the intended inferential goal. An estimation problem may target a confidence-interval width. A hypothesis test may target power against a scientifically meaningful effect. A prevalence study depends on expected prevalence and desired precision. Clustered designs depend on intracluster correlation, and repeated-measures designs depend on within-person correlation. There is no universal number of observations that makes a study adequate.
Power is primarily a design quantity. Before data collection,
describes the probability that a planned test rejects the null under a specified alternative. After the experiment, the estimate and its uncertainty describe what was learned more directly. Observed or post-hoc power usually adds little because it largely repackages the observed test statistic or p-value.
Outcome prespecification and multiplicity belong to the same family of problems. If a study records many outcomes, subgroups, time points and models, the final reported result exists within a larger selection process. The first requirement is transparency about how many opportunities there were to find the reported pattern. One isolated p-value cannot describe that process.
Measurement validity is equally fundamental. If a target construct $T$ is observed through
where $B$ represents nuisance structure and $\varepsilon$ random error, a huge experiment can estimate the intervention effect on $X$ very precisely while remaining weak evidence about $T$. Calibration, construct validity, measurement invariance and instrument reliability are therefore part of design quality.
Missing data require the same explicitness. If outcomes are missing more often among participants doing poorly, complete-case analysis conditions on being observed and may distort the comparison. Preventing missingness, documenting its pattern, stating assumptions and performing sensitivity analyses are therefore more informative than applying a default imputation method without discussing the missingness mechanism.
The same logic applies to effect sizes and uncertainty. Reporting only
hides the magnitude of the effect. Scientific interpretation usually needs an estimate $\hat\theta$, an uncertainty interval and an effect measure that corresponds to the decision. Risk differences, risk ratios, odds ratios, hazard ratios and absolute risks answer different questions and are not interchangeable summaries.
Sensitivity analysis asks whether the conclusion depends on assumptions or analytical choices that should not control the science. If the result changes after one influential observation is removed, under a plausible alternative missing-data assumption, or when a confounder is defined differently, that instability is part of the result. Sensitivity analysis is not the indiscriminate search over every possible model. It is targeted stress testing of consequential assumptions.
Reporting guidelines make these design and analysis choices visible. CONSORT, SPIRIT, STROBE, PRISMA, STARD, TRIPOD+AI, ARRIVE, COREQ and SRQR all improve transparency for different study families, and the EQUATOR Network catalogues many such frameworks. They do not certify truth or methodological validity. STROBE explicitly distinguishes reporting guidance from quality assessment, and the same principle applies more broadly: a badly designed study can be reported transparently. Transparency is still valuable because it makes the weakness inspectable.
Evidence becomes stronger through triangulation, replication and criticism
A scientific result should not be protected from being tested again. Direct replication asks whether a result is stable under similar conditions. Conceptual replication asks whether the underlying idea survives different operationalisations or populations. A failed replication does not automatically imply misconduct, and a successful replication does not establish universality. Both alter the evidential state.
Evidence can also become stronger when different designs with different failure modes converge. Suppose a causal hypothesis is supported by a cohort study, a randomised trial, mechanistic evidence, a natural experiment and independent replication. The strength does not come merely from having more studies. It comes from the fact that the studies rely on different assumptions. A single hidden bias is less likely to explain convergent results if the pathways through which error could enter are genuinely different.
This is why good scientific criticism identifies a failure mechanism rather than attacking a study label. Saying that a study is observational is weaker than showing that exposure is self-selected, important confounders are poorly measured and the analysis does not establish comparability. Calling an RCT definitive is weaker than examining attrition, protocol deviations, allocation concealment and outcome switching. Calling a meta-analysis decisive is weaker than examining the risk of bias in its component studies, the consistency of the estimands and the extent of heterogeneity.
A useful reading sequence is therefore:
- What is the scientific question?
- What is the estimand?
- What population does the estimand refer to?
- What was actually measured?
- What design generated the comparison?
- Which assumptions connect the observed data to the target quantity?
- How large is the estimated effect or association?
- How uncertain is it?
- Which biases remain plausible?
- Which decisions were prespecified and which were exploratory?
- Has the result been replicated or challenged?
- How does it fit evidence generated under different designs and assumptions?
This sequence prevents one impressive feature from dominating the appraisal. A large sample cannot erase confounding. Randomisation cannot repair invalid measurement. A systematic review cannot repair biased primary studies. A meta-analysis cannot create a common estimand when the studies estimate different things.
The scientific method is therefore best understood as a system of constraints. Randomisation constrains confounding. Allocation concealment constrains selection during enrolment. Blinding constrains behavioural and measurement effects. Preregistration constrains undisclosed analytic flexibility. Sample-size and precision calculations constrain uninformative design. Validation constrains measurement error. Sensitivity analysis constrains dependence on modelling choices. Replication constrains study-specific accidents. Systematic review constrains selective citation. Meta-analysis constrains informal weighting of quantitative evidence. Open methods constrain unverifiable analysis.
None of these procedures guarantees truth. Their value is that they make different classes of error harder to hide.
The design should therefore match the question. A case report can be the right design for documenting a previously unknown event. A cross-sectional survey can be the right design for prevalence. A cohort can be the right design for prognosis. A case-control study can be efficient for rare outcomes. A randomised trial can be the strongest feasible design for many intervention effects. A natural experiment can identify effects that cannot ethically be randomised. A mechanistic experiment can explain why an effect occurs. A qualitative study can explain implementation and experience. A systematic review can organise the evidence base. A meta-analysis can quantify evidence when the component studies are sufficiently comparable.
The scientific method does not ask which label sits highest on a pyramid. It asks whether the question, estimand, population, design, measurement, analysis and interpretation form a defensible chain.
References
Chan, A.-W., Boutron, I., Hopewell, S., Moher, D., Schulz, K. F., Collins, G. S., et al. (2025). SPIRIT 2025 statement: updated guideline for protocols of randomised trials. BMJ, 389, e081477.
Collins, G. S., Moons, K. G. M., Dhiman, P., Riley, R. D., Beam, A. L., Van Calster, B., et al. (2024). TRIPOD+AI statement: updated guidance for reporting clinical prediction models that use regression or machine learning methods. BMJ, 385, e078378. https://doi.org/10.1136/bmj-2023-078378
Deeks, J. J., Higgins, J. P. T., Altman, D. G., McKenzie, J. E., & Veroniki, A. A. (2024). Analysing data and undertaking meta-analyses. In Cochrane Handbook for Systematic Reviews of Interventions, version 6.5.
Greenland, S., Pearl, J., & Robins, J. M. (1999). Causal diagrams for epidemiologic research. Epidemiology, 10(1), 37–48.
Hernán, M. A., & Robins, J. M. (2020). Causal Inference: What If. Chapman & Hall/CRC.
Hopewell, S., Chan, A.-W., Collins, G. S., Hróbjartsson, A., Moher, D., Schulz, K. F., et al. (2025). CONSORT 2025 statement: updated guideline for reporting randomised trials. BMJ, 389, e081123. https://doi.org/10.1136/bmj-2024-081123
Kilkenny, C., Browne, W. J., Cuthill, I. C., Emerson, M., & Altman, D. G. (2010). Improving bioscience research reporting: the ARRIVE guidelines for reporting animal research. PLoS Biology, 8(6), e1000412.
O'Brien, B. C., Harris, I. B., Beckman, T. J., Reed, D. A., & Cook, D. A. (2014). Standards for reporting qualitative research: a synthesis of recommendations. Academic Medicine, 89(9), 1245–1251.
Page, M. J., McKenzie, J. E., Bossuyt, P. M., Boutron, I., Hoffmann, T. C., Mulrow, C. D., et al. (2021). The PRISMA 2020 statement: an updated guideline for reporting systematic reviews. BMJ, 372, n71. https://doi.org/10.1136/bmj.n71
Rothman, K. J., Greenland, S., & Lash, T. L. (2008). Modern Epidemiology (3rd ed.). Lippincott Williams & Wilkins.
Tong, A., Sainsbury, P., & Craig, J. (2007). Consolidated criteria for reporting qualitative research (COREQ): a 32-item checklist for interviews and focus groups. International Journal for Quality in Health Care, 19(6), 349–357.
von Elm, E., Altman, D. G., Egger, M., Pocock, S. J., Gøtzsche, P. C., & Vandenbroucke, J. P. (2007). The Strengthening the Reporting of Observational Studies in Epidemiology (STROBE) statement. The Lancet, 370(9596), 1453–1457. https://doi.org/10.1016/S0140-6736(07)61602-X
Embed interactive plots, widgets, and demos using <figure>, <iframe>, or <div class="interactive-embed"> containers. Ensure each embed includes descriptive captions for accessibility.
How to cite
Use the quick export buttons to save citations for reference managers or copy the formatted text directly.
Diogo Ribeiro (2025). Not All Studies Answer the Same Question. Faculty of Media Arts and Design, Technical University of Porto. https://diogoribeiro7.github.io/science-communication/not_all_studies_answer_the_same_question/.


