Topics
A watch vibrates and reports an irregular heart rhythm. Somewhere in the product's evidence is a reassuring percentage. How much does that percentage tell the person looking at the screen?
The answer depends on what was counted. Detecting a pattern in a pulse signal, confirming a rhythm on an electrocardiogram, and improving someone's health are separate achievements. Evidence for one does not automatically establish the others.
This distinction is part of the technology's intended use. For example, the FDA's original assessment of Apple's irregular rhythm notification feature describes optical pulse measurements used to flag patterns consistent with atrial fibrillation. It explicitly distinguishes that feature from diagnosis and treatment decisions. That is a description of the assessed feature, not a claim that every watch or every function on a watch has the same capabilities. FDA device assessment.
We can make the interpretation problem concrete without guessing the performance of any particular device.
Follow 10,000 people through a hypothetical screen
Imagine one prespecified, evaluable screening opportunity for each of 10,000 people. A reference assessment establishes whether the target condition is present during that opportunity.
Assume the hypothetical algorithm has:
- 90% sensitivity: it alerts for 90 of every 100 people who have the target condition.
- 95% specificity: it produces no alert for 95 of every 100 people who do not have it.
These are invented operating characteristics. The prevalences below are also illustrative; they are not estimates for atrial fibrillation in smartwatch users.
First suppose 1% of the population has the condition. Among 10,000 people, that means 100 affected people and 9,900 unaffected people.
The algorithm produces 90 true alerts and misses 10 affected people. Its 5% false-positive rate produces another 495 alerts among unaffected people.
There are therefore 585 alerts, of which 90 are correct:
The 90% sensitivity was never a promise that an alerted person had a 90% probability of the condition. It used affected people as its denominator. The question after an alert uses alerted people as its denominator.
Now keep the hypothetical sensitivity and specificity unchanged, while changing the population:
| Condition prevalence | True alerts | False alerts | Affected people missed | True share of alerts |
|---|---|---|---|---|
| 1% | 90 | 495 | 10 | 15.4% |
| 5% | 450 | 475 | 50 | 48.6% |
| 20% | 1,800 | 400 | 200 | 81.8% |
Each row describes expected counts in 10,000 people. The last column is the positive predictive value, or PPV.
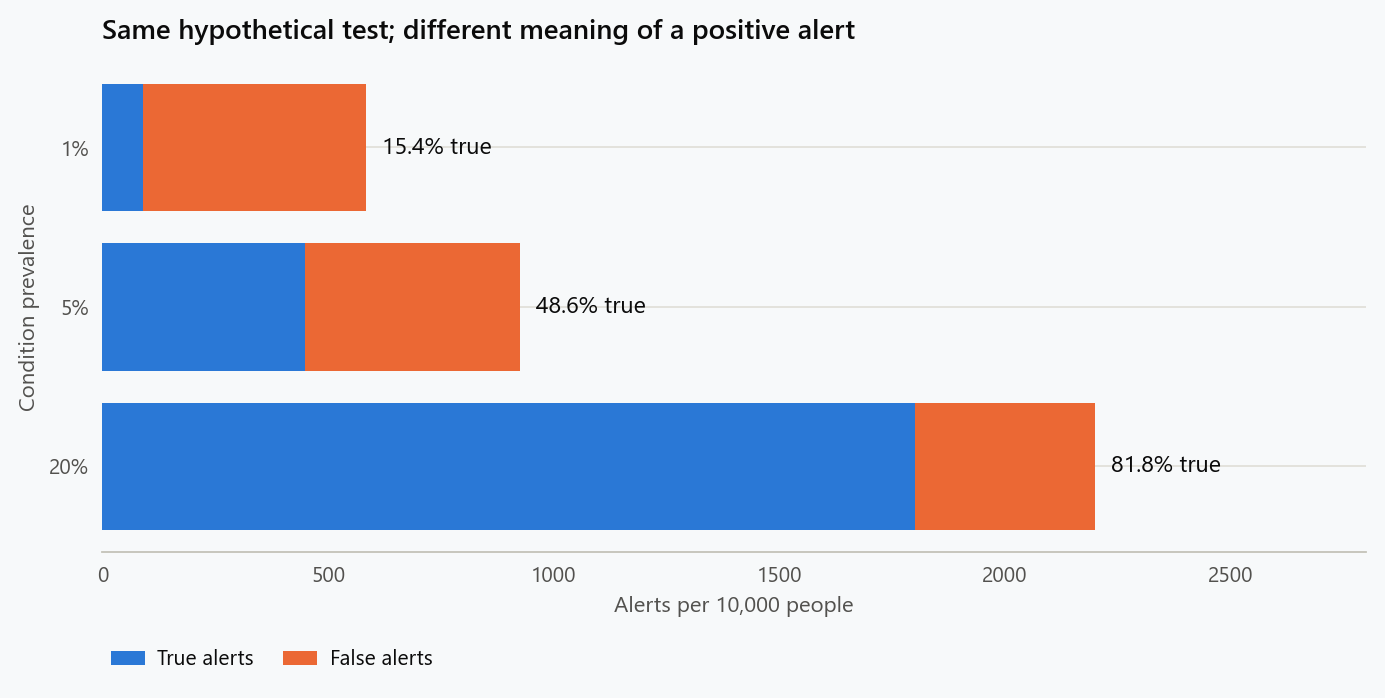
Original calculation: one evaluable opportunity per person, 90% sensitivity, and 95% specificity. These are hypothetical populations and test characteristics.
This comparison explains why evidence from a selected clinical population cannot simply be pasted onto a broad consumer population. It also shows that a low PPV does not, by itself, tell us whether a screening pathway is worthwhile. That requires considering what happens after the alert, what is missed, and the consequences of each outcome.
For prevalence $p$, sensitivity $s$, and specificity $c$, the calculation is
Holding $s$ and $c$ fixed isolates the effect of prevalence. In an actual deployment, their values may change too: the evaluated people, recording conditions, and target episodes may differ. The table is a controlled example, not a transportability guarantee.
Two percentages can describe different events
In the 2019 Apple Heart Study, 2,161 of 419,297 participants received irregular-pulse notifications. Among 450 who returned analyzable ECG patches, 34% had atrial fibrillation detected. Patches were applied an average of 13 days after the initial notification.
A separate analysis examined 86 participants who received notifications while wearing a patch. Concurrent ECG strips showed atrial fibrillation in 72, giving an estimated notification PPV of 84% in that group, with a 95% confidence interval of 76–92%. Perez and colleagues, New England Journal of Medicine.
Those results answer different questions:
| Reported result | What was evaluated? |
|---|---|
| 34% | Detection during later patch monitoring among people returning analyzable patches |
| 84% | Concurrent confirmation among participants with notifications during patch use |
Neither percentage describes immediate verification of all initial alerts. A later negative recording cannot exclude an earlier transient episode. The concurrent-confirmation group also cannot establish sensitivity among people without alerts. The denominators and timing explain why the percentages differ.
Continuous use needs an explicit unit of evaluation
Our toy calculation has one opportunity per person. A wearable workflow can contain many attempted recordings, selected signal segments, repeated alerts, and episodes of varying duration.
Consider a purely mathematical illustration: if an unaffected person had 100 independent opportunities, each with a 1% false-alert probability, the chance of at least one false alert would be
This is not an estimate for a wearable. Independence is a strong assumption, and a device may combine repeated readings before producing one notification. The calculation demonstrates why an error rate per segment cannot be interpreted as an error rate per person over a year.
A report should make the counting unit visible. “Per recording,” “per episode,” and “per participant during six months” refer to different experiments. A hundred recordings from one person also do not provide the same independent evidence as one recording from each of a hundred people.
The denominator must account for unusable measurements too. If a system attempts 100 recordings but evaluates only 60, accuracy on those 60 describes the evaluable subset. It leaves a separate question about coverage. An unevaluable recording should not silently become a negative result in an evaluation table.
Follow-up determines what we can learn
Suppose people with alerts are invited for confirmation, but only some attend. A confirmation percentage calculated among attendees describes those attendees. Generalising it requires a reason to believe the missing confirmations would behave similarly, or an analysis of how departures from that assumption change the result.
The same issue appears on the other side of the table. Verifying only alerts leaves missed cases among people without alerts unobserved. A denominator containing only positive screens cannot identify sensitivity, however carefully the positive screens were adjudicated.
An evaluation designed to estimate missed cases needs reference information from people without alerts as well, perhaps through an appropriately sampled verification group. The sampling scheme and any weighting then become part of the method.
For a health technology team, this suggests a practical evidence record:
| Stage | Information to preserve |
|---|---|
| Measurement | Attempted recordings, evaluable recordings, observation duration |
| Notification | Algorithm version, counting unit, first and repeated alerts |
| Confirmation | Who was assessed, by which reference method, and after what delay |
| Outcome | Subsequent actions and their benefits, burdens, and harms |
These fields help distinguish an algorithm problem from a measurement problem or a follow-up problem. They also prevent a product change that suppresses difficult readings from appearing to improve performance merely by shrinking the evaluated population.
Detection has to connect to a useful next step
An accurate alert can still lead to an ineffective care pathway. Conversely, an imperfect screen may be useful if confirmation is appropriate and the resulting decisions improve outcomes. Both claims require evidence about the pathway.
The FDA's work on post-market evaluation of smartwatch cardiovascular notifications explicitly considers whether notifications lead to appropriate care, alongside the possibility of unnecessary testing or treatment following false notifications. That is a broader question than agreement between an algorithm and a reference recording. FDA research description.
For the person receiving an alert, its defensible meaning is that the feature has identified a pattern that should be interpreted through its instructions and, where indicated, clinical assessment. The alert alone does not select a treatment. Absence of an alert is likewise not an all-clear result for heart health.
For someone assessing a study or a product claim, four questions make the percentage useful: who was observed, what counted as one observation, when confirmation occurred, and which participants remained unverified. A performance number with those details is evidence we can examine. Without them, it is easy to answer a different question from the one the reader actually has.
Reproduce the counts
This example uses expected counts, so no simulation or random seed is needed:
1
2
3
4
5
6
7
8
9
10
11
12
n = 10_000
sensitivity, specificity = 0.90, 0.95

for prevalence in (0.01, 0.05, 0.20):
    affected = n * prevalence
    unaffected = n - affected
    true_alerts = sensitivity * affected
    false_alerts = (1 - specificity) * unaffected
    missed = (1 - sensitivity) * affected
    ppv = true_alerts / (true_alerts + false_alerts)
    print(f"{prevalence:.0%}: TP={true_alerts:.0f}, "
          f"FP={false_alerts:.0f}, FN={missed:.0f}, PPV={ppv:.1%}")
The figure generator reproduces the table and chart. For the general model-monitoring version of the prevalence question, see Prevalence Shift and Base-Rate Drift.
Embed interactive plots, widgets, and demos using <figure>, <iframe>, or <div class="interactive-embed"> containers. Ensure each embed includes descriptive captions for accessibility.
How to cite
Use the quick export buttons to save citations for reference managers or copy the formatted text directly.
Diogo Ribeiro (2026). What a Wearable Heart Alert Can Actually Tell You. Faculty of Media Arts and Design, Technical University of Porto. https://diogoribeiro7.github.io/healthcare/what_a_wearable_heart_alert_can_tell_you/.