Topics
The human gut microbiome is one of the most active areas of biomedical research and one of the easiest to overinterpret. A stool sample can be sequenced cheaply enough to produce a report listing hundreds or thousands of microbial taxa, with diversity metrics, coloured bar charts and personalised recommendations. The report may assign a gut-health score, sort organisms into beneficial and harmful, compute a dysbiosis index, and recommend foods, prebiotics or probiotics to move the microbiome towards a healthier state. The sequencing technology is real and impressive. The clinical meaning of what it produces is much less mature.
Diagnostic medicine separates three questions that such reports run together. Analytical validity asks whether the test measures what it says, reproducibly. Clinical validity asks whether the measurement identifies a condition. Clinical utility asks whether acting on the result improves anything. A test can pass the first and fail the others, and it can produce a biologically interesting signal that has no validated threshold, no agreed reference range and no demonstrated benefit when acted upon. Consumer microbiome testing sits in that gap, and the first of the three questions now has a direct answer.
One Sample, Seven Companies
Scientists at the United States National Institute of Standards and Technology took a homogenised pool of human stool, developed as a reference material, and used it to fill three kits from each of seven direct-to-consumer companies, without telling the companies (Servetas et al., 2026). Every kit therefore contained the same material, and any difference between reports is a difference in method. The number of genera reported ranged from 34 to 906. Across the companies and NIST's own two sequencing methods, 1,208 distinct taxa were named, and only three genera appeared in every report. One company's three replicates listed 1,471, 1,626 and 1,701 species.
The disagreements were not confined to rare organisms. All seven companies reported on Clostridioides difficile, a pathogen with clinical consequences: three said it was present and four said it was absent, in the same stool. One company described the sample as healthy for two of its replicates and unhealthy for the third, which, as the authors note, could lead to unnecessary interventions if a customer received it. The paper also records that there is no regulator-approved clinical microbiome diagnostic in the United States. None of this is surprising to people who work in the field, where the choice of sequencing method, DNA extraction, reference database and reporting threshold is known to shape the result, but it has rarely been shown so plainly with the products people buy.
A Snapshot of a Moving System
Suppose the laboratory were perfect. A stool sample would still be one day's output of a system that changes daily. In 20 women who provided a sample every day for six weeks, 713 samples in all, the abundance of 78% of genera varied more within one person over time than it differed between people, and 72% of genera shifted more than tenfold between consecutive days (Vandeputte et al., 2021). Those figures are for absolute abundances, measured by combining sequencing with cell counts. For the relative abundances that consumer tests report, 36% of genera varied more within than between people. A Swedish study that followed 75 healthy adults for a year attributed 23% of the total variation in composition to change within individuals (Olsson et al., 2022).
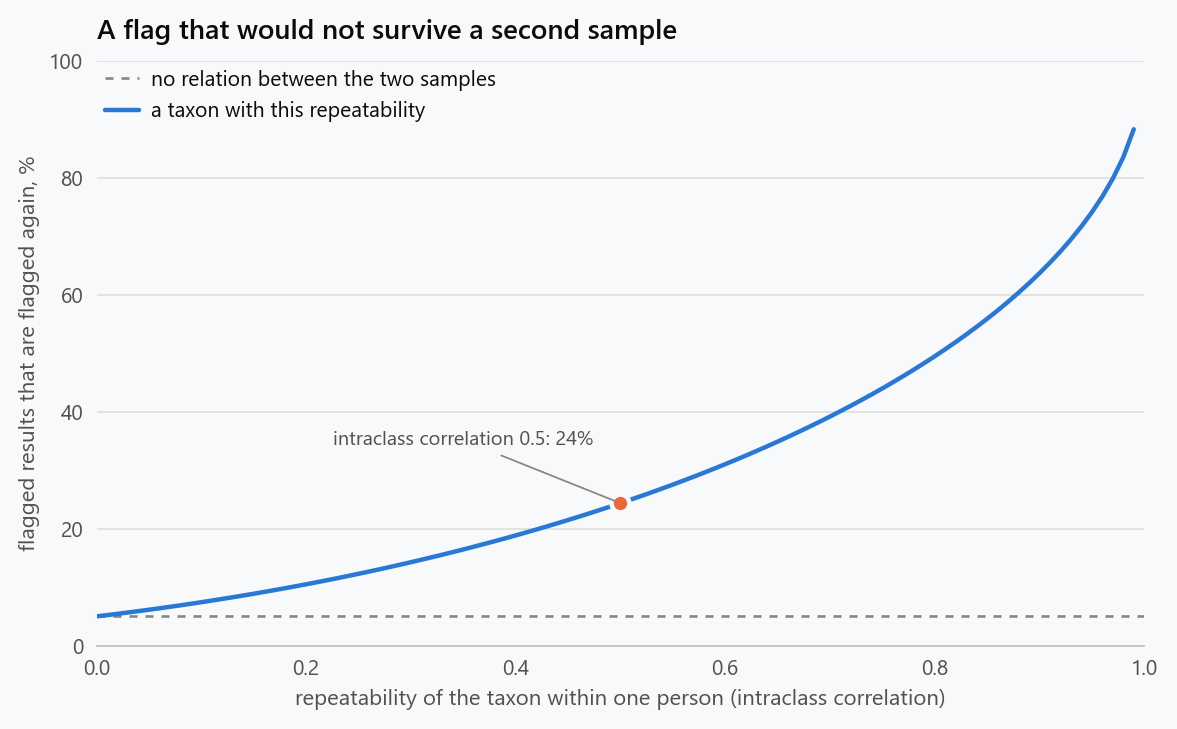
The consequence for a report can be computed. The intraclass correlation of a taxon is the correlation between two samples from the same person, and "varies more within than between" means a value below 0.5. Suppose a report flags a genus as high when it lies in the top 5% of the healthy range, and treat the two samples as jointly normal. At an intraclass correlation of 0.5, a flagged genus is flagged again in a second sample 24.4% of the time, and at 0.3 only 14.3% of the time. Even at 0.9, a repeatability that few taxa reach, more than a third of flags disappear on retesting. For at least a third of the genera on a report, a striking result is more likely than not to be gone next week. One sample cannot separate a person's usual state from that day's.
A stool sample is also a sample of stool. The communities attached to the lining of the small intestine and colon differ from what is excreted, and stool consistency, which reflects transit time, is the single covariate with the largest effect on composition in population studies (Falony et al., 2016). What a person ate, how quickly it moved and what medicines they took that week are all in the result.
A Percentage Is Not a Count
Sequencing yields proportions. The total number of reads is set by the instrument and not by the gut, so the report can say that a genus makes up 12% of the community and cannot say how many cells there are. Proportions are tied together: if one goes up, the others go down, whether or not anything happened to them. If a taxon holding a share $p$ of the community multiplies its absolute count by $k$ while every other taxon stays exactly as it was, each of the others has its share multiplied by
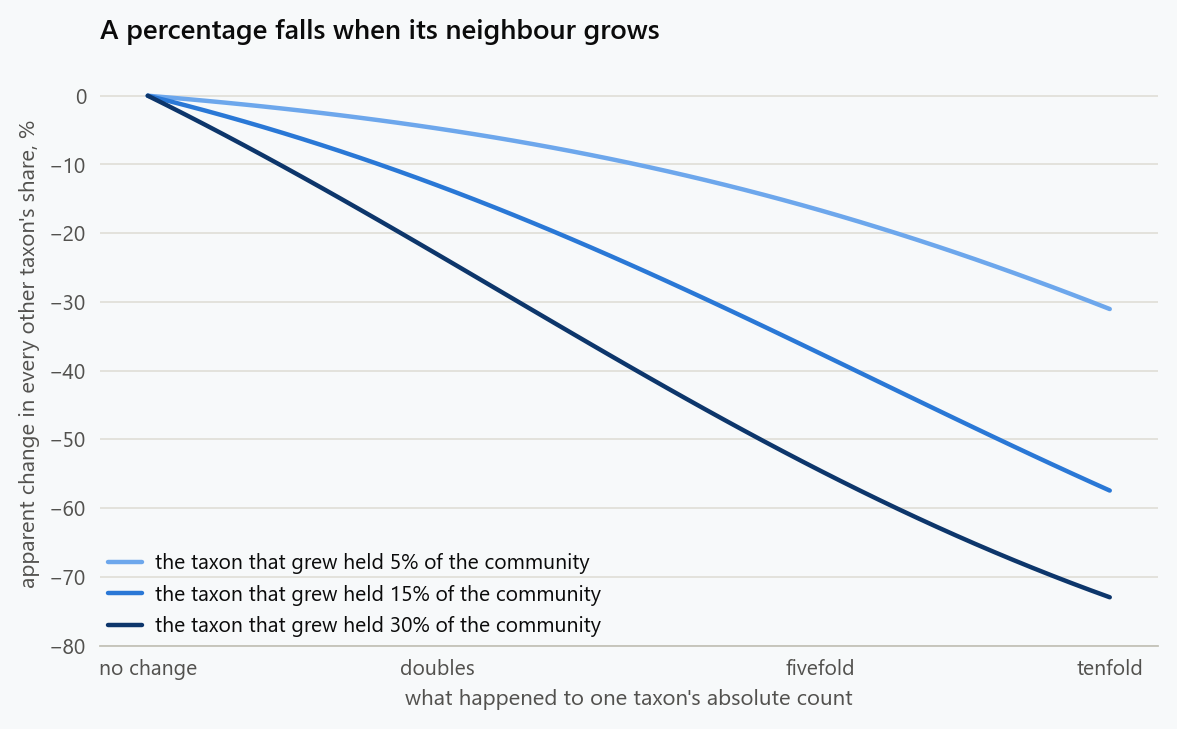
When a genus that holds 30% of the community doubles, every other genus appears to fall by 23%, and when it rises tenfold, which the daily study shows is an ordinary event, they appear to fall by 73%. A report would show dozens of "depleted" beneficial bacteria when in fact a single organism bloomed. The total matters as well as the parts. In a dataset of 34,539 metagenomes, faecal microbial load was the major determinant of microbiome variation, and adjusting for it substantially reduced the statistical significance of the majority of disease-associated species (Nishijima et al., 2025). The consensus statement discussed below asks that results be labelled clearly as percentages, precisely so that relative abundances are not read as absolute numbers.
Healthy Ranges for a Thousand Taxa
Consumer reports compare each taxon with a range derived from the company's other customers and mark those outside it. With a range that contains 95% of healthy people, each taxon flags one healthy person in twenty, and a report listing 100 taxa flags five on average, with a 99.4% chance of flagging at least one. One of the companies in the NIST study compared results with the interquartile range of its reference population, a band that by definition puts half of all healthy results, 50 of 100, outside it. The customer receives a list of abnormalities whose length was fixed by the design of the report and carries no information about them. Taxa are correlated, which changes the variance of that count and not its expectation.
The summary scores fare no better. Dysbiosis is not a well-defined condition, and a review of the indexes used to quantify it found that their methods, and the cohorts and diseases they were built on, differ considerably (Wei et al., 2021). The ratio of Firmicutes to Bacteroidetes, still printed on many reports as a marker of obesity, came from early studies that did not replicate: a pooled reanalysis of ten studies found no association between the ratio and obesity, and a later review describes the literature as contradictory and attributes the discrepancies to differences in sample processing and sequence analysis (Sze & Schloss, 2016; Magne et al., 2020). Diversity did differ between obese and non-obese people in the pooled data, by 2.07%, only one of the ten studies had the power to detect a difference of 5%, and a classifier trained on one dataset identified obesity in the others with a median accuracy of 56.68%.
Known factors explain little of the variation between people in any case: 126 host and environmental factors together accounted for 18.7% of it in a Dutch cohort of 1,135 (Zhernakova et al., 2016). If four fifths of the difference between two healthy people is unexplained, there is no basis for calling one of them abnormal.
What the Field Itself Recommends
In 2025 an international panel of 69 experts from 18 countries published a consensus on microbiome testing in clinical practice, reached by a Delphi process (Porcari et al., 2025). It is the closest thing to an official position, and its statements are specific. There is insufficient evidence to widely recommend the routine use of microbiome testing in clinical practice (90% agreement). Reporting the Firmicutes-to-Bacteroidetes ratio is discouraged (86%). There is insufficient evidence to include any dysbiosis index in a report (90%). There is not enough information to report strict healthy reference ranges for the relative abundance of species (90%).
| Practice | Consensus statement | Agreement |
|---|---|---|
| Routine testing in clinical practice | Insufficient evidence to recommend | 90% |
| Firmicutes-to-Bacteroidetes ratio | Reporting discouraged | 86% |
| Dysbiosis indexes | Insufficient evidence to include | 90% |
| Healthy ranges for species | Not enough information to report strict ranges | 90% |
| Therapeutic advice from the testing provider | Discouraged | 98% |
| Testing requested by the patient without clinical advice | Discouraged | 80.4% |
The two statements with most bearing on the consumer market are the last two. The panel discourages the testing provider from giving any therapeutic advice after the test, with 98% agreement, and discourages direct requests by patients without a clinical recommendation. A product that a customer orders online and that ends in a list of recommended supplements, often sold by the same company, is the arrangement the panel advises against on both counts. The panel does not dismiss the technology. It recommends comparison with matched healthy controls, the reporting of diversity measures, and research to establish what the results mean, and it notes the one established clinical use of microbiome manipulation, faecal microbiota transplantation for recurrent C. difficile infection.
Personalised Nutrition
The most attractive promise is a diet tailored to one's microbes, and here there is real evidence, which deserves to be read at its actual size. In the PREDICT 1 study of 1,002 adults given identical meals, responses varied widely between people, with a coefficient of variation of 68% for blood glucose and 103% for triglycerides. For the glucose response, the gut microbiome explained 6.0% of the variance and the macronutrient content of the meal 15.4%; for the triglyceride response the order was reversed, 7.1% against 3.6% (Berry et al., 2020). The microbiome contributes to prediction. It contributes less to the glucose response than reading the label on the food.
Randomised trials are the test of utility. An 18-week app-based programme that used glucose and triglyceride responses, the microbiome and health history to score foods was compared with standard dietary advice in 347 adults. It reduced triglycerides by 0.13 mmol/L, one of its two primary outcomes, while the other, LDL cholesterol, is not among the outcomes reported as improved, and blood pressure, insulin, glucose, C-peptide and apolipoproteins did not differ between groups (Bermingham et al., 2024). Weight and waist circumference improved, in a comparison with standard advice delivered through online resources, check-ins and a leaflet. Such a trial cannot show what the microbiome component added, because it was never varied separately. A programme can work as a whole, through attention, monitoring and better food, while the stool test contributes nothing that was measured.
What a Defensible Report Would Say
Nothing here denies that the microbiome matters, or that testing will one day be useful. It already is in defined settings: detecting specific pathogens with validated assays, screening donors for faecal transplantation, and research. The problem is a product sold to people with common symptoms that medicalises normal variation. A customer with bloating receives a report with a low score, a dozen flagged organisms and a recommended purchase, and has no way to know that another company would have named different organisms, that a second sample would have moved the flags, or that flags were guaranteed by the arithmetic.
An honest report is easy to describe. It would state the method and its detection threshold, give results as percentages and say that they are not counts, report how much each listed taxon varies from day to day in one person, decline to label organisms as good or bad outside a clinical context, omit the Firmicutes-to-Bacteroidetes ratio and any dysbiosis score, say that no healthy range exists for most of what it lists, and recommend nothing for sale. It would add that persistent gastrointestinal symptoms call for a clinician, who has validated tests for coeliac disease, inflammatory bowel disease and infection. Such a report would be less impressive to receive, and it would be accurate.
References
- Bermingham, K. M., Linenberg, I., Polidori, L., Asnicar, F., Arrè, A., Wolf, J., … Berry, S. E. (2024). Effects of a personalized nutrition program on cardiometabolic health: a randomized controlled trial. Nature Medicine, 30(7), 1888-1897. https://doi.org/10.1038/s41591-024-02951-6
- Berry, S. E., Valdes, A. M., Drew, D. A., Asnicar, F., Mazidi, M., Wolf, J., … Spector, T. D. (2020). Human postprandial responses to food and potential for precision nutrition. Nature Medicine, 26(6), 964-973. https://doi.org/10.1038/s41591-020-0934-0
- Falony, G., Joossens, M., Vieira-Silva, S., Wang, J., Darzi, Y., Faust, K., … Raes, J. (2016). Population-level analysis of gut microbiome variation. Science, 352(6285), 560-564. https://doi.org/10.1126/science.aad3503
- Magne, F., Gotteland, M., Gauthier, L., Zazueta, A., Pesoa, S., Navarrete, P., & Balamurugan, R. (2020). The Firmicutes/Bacteroidetes ratio: a relevant marker of gut dysbiosis in obese patients? Nutrients, 12(5), 1474. https://doi.org/10.3390/nu12051474
- Nishijima, S., Stankevic, E., Aasmets, O., Schmidt, T. S. B., Nagata, N., Keller, M. I., … Bork, P. (2025). Fecal microbial load is a major determinant of gut microbiome variation and a confounder for disease associations. Cell, 188(1), 222-236. https://doi.org/10.1016/j.cell.2024.10.022
- Olsson, L. M., Boulund, F., Nilsson, S., Khan, M. T., Gummesson, A., Fagerberg, L., … Bäckhed, F. (2022). Dynamics of the normal gut microbiota: a longitudinal one-year population study in Sweden. Cell Host & Microbe, 30(5), 726-739. https://doi.org/10.1016/j.chom.2022.03.002
- Porcari, S., Mullish, B. H., Asnicar, F., Ng, S. C., Zhao, L., Hansen, R., … Ianiro, G. (2025). International consensus statement on microbiome testing in clinical practice. The Lancet Gastroenterology & Hepatology, 10(2), 154-167. https://doi.org/10.1016/S2468-1253(24)00311-X
- Servetas, S. L., Gierz, K. S., Hoffmann, D., Ravel, J., & Jackson, S. A. (2026). Evaluating the analytical performance of direct-to-consumer gut microbiome testing services. Communications Biology, 9(1), 269. https://doi.org/10.1038/s42003-025-09301-3
- Sze, M. A., & Schloss, P. D. (2016). Looking for a signal in the noise: revisiting obesity and the microbiome. mBio, 7(4), e01018-16. https://doi.org/10.1128/mBio.01018-16
- Vandeputte, D., De Commer, L., Tito, R. Y., Kathagen, G., Sabino, J., Vermeire, S., Faust, K., & Raes, J. (2021). Temporal variability in quantitative human gut microbiome profiles and implications for clinical research. Nature Communications, 12(1), 6740. https://doi.org/10.1038/s41467-021-27098-7
- Wei, S., Bahl, M. I., Baunwall, S. M. D., Hvas, C. L., & Licht, T. R. (2021). Determining gut microbial dysbiosis: a review of applied indexes for assessment of intestinal microbiota imbalances. Applied and Environmental Microbiology, 87(11), e00395-21. https://doi.org/10.1128/AEM.00395-21
- Zhernakova, A., Kurilshikov, A., Bonder, M. J., Tigchelaar, E. F., Schirmer, M., Vatanen, T., … Fu, J. (2016). Population-based metagenomics analysis reveals markers for gut microbiome composition and diversity. Science, 352(6285), 565-569. https://doi.org/10.1126/science.aad3369
This article discusses the clinical interpretation of consumer microbiome testing. Persistent gastrointestinal symptoms or suspected disease require validated clinical assessment rather than interpretation of a commercial microbiome score alone.
Embed interactive plots, widgets, and demos using <figure>, <iframe>, or <div class="interactive-embed"> containers. Ensure each embed includes descriptive captions for accessibility.
How to cite
Use the quick export buttons to save citations for reference managers or copy the formatted text directly.
Diogo Ribeiro (2026). A Stool Sample Is Not a Diagnosis. Faculty of Media Arts and Design, Technical University of Porto. https://diogoribeiro7.github.io/healthcare/consumer_microbiome_testing_limits/.