Run registered diagnostic plots
Usage
runDiagnosticPlots(
  model,
  plots = c("residuals_fitted", "spread_level", "density", "qq", "bubble_variance")
)Examples
runDiagnosticPlots(lm(mpg ~ wt, mtcars))
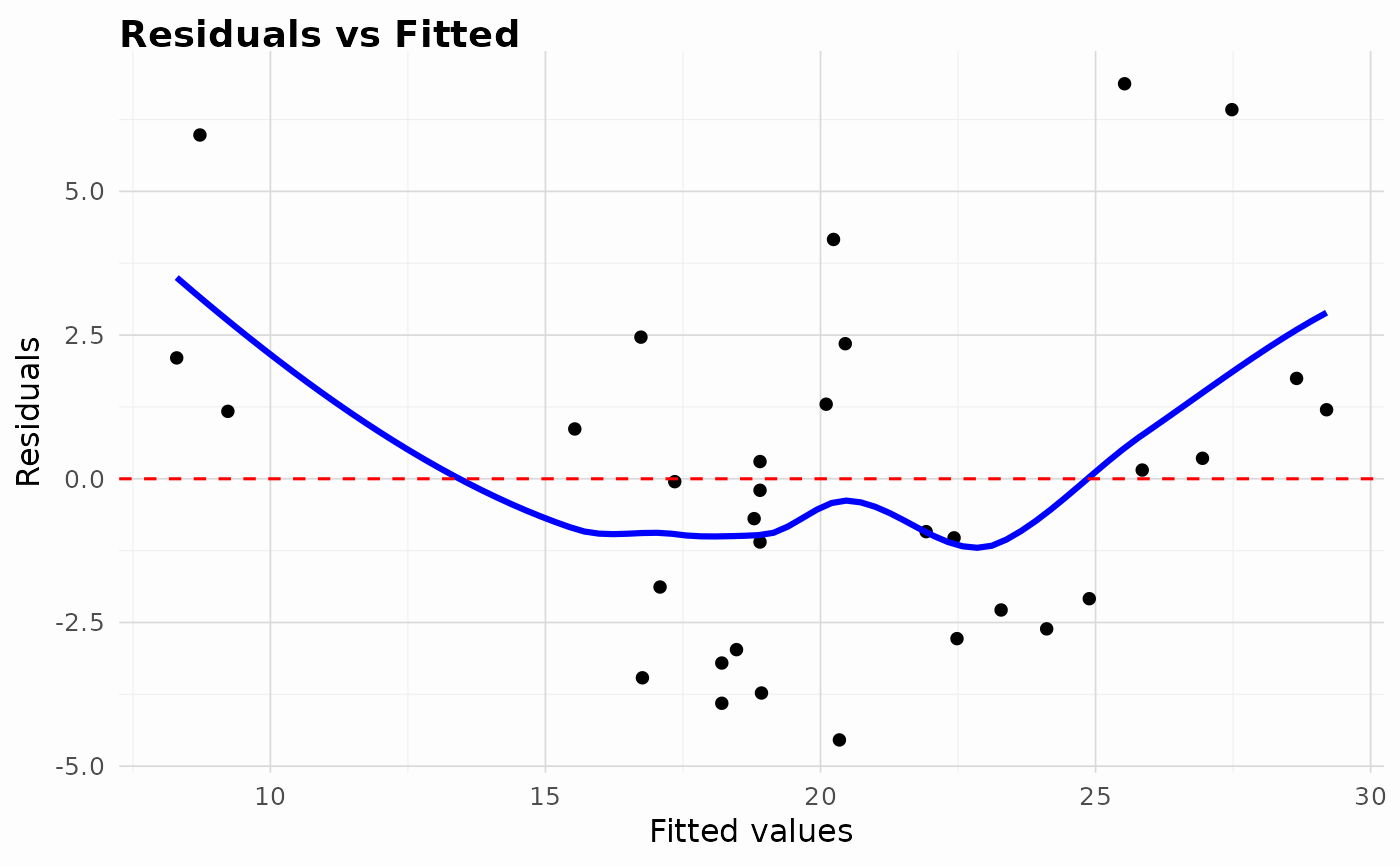
#> $residuals_fitted
#> `geom_smooth()` using formula = 'y ~ x'
 #>
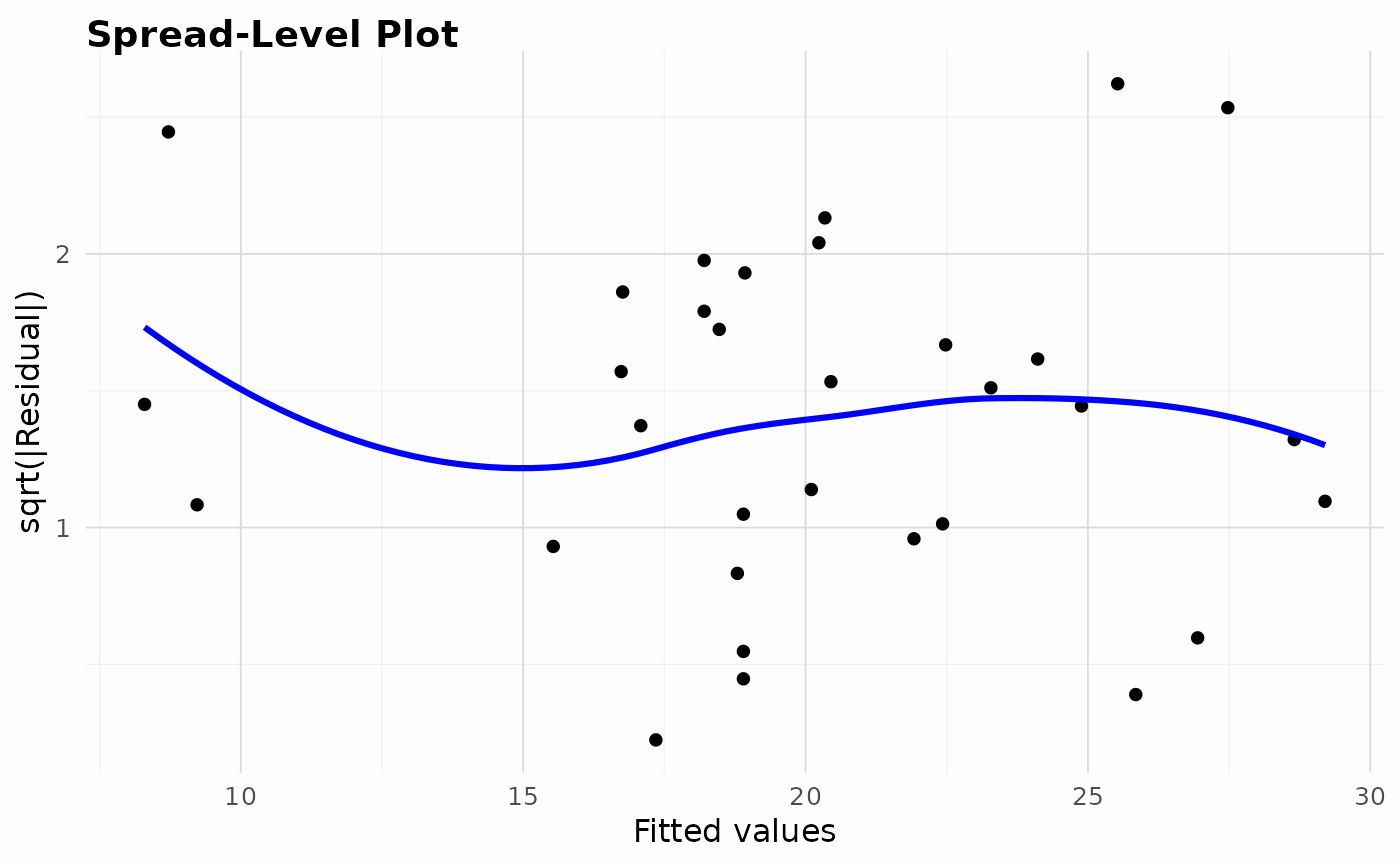
#> $spread_level
#> `geom_smooth()` using formula = 'y ~ x'
#>
#> $spread_level
#> `geom_smooth()` using formula = 'y ~ x'
 #>
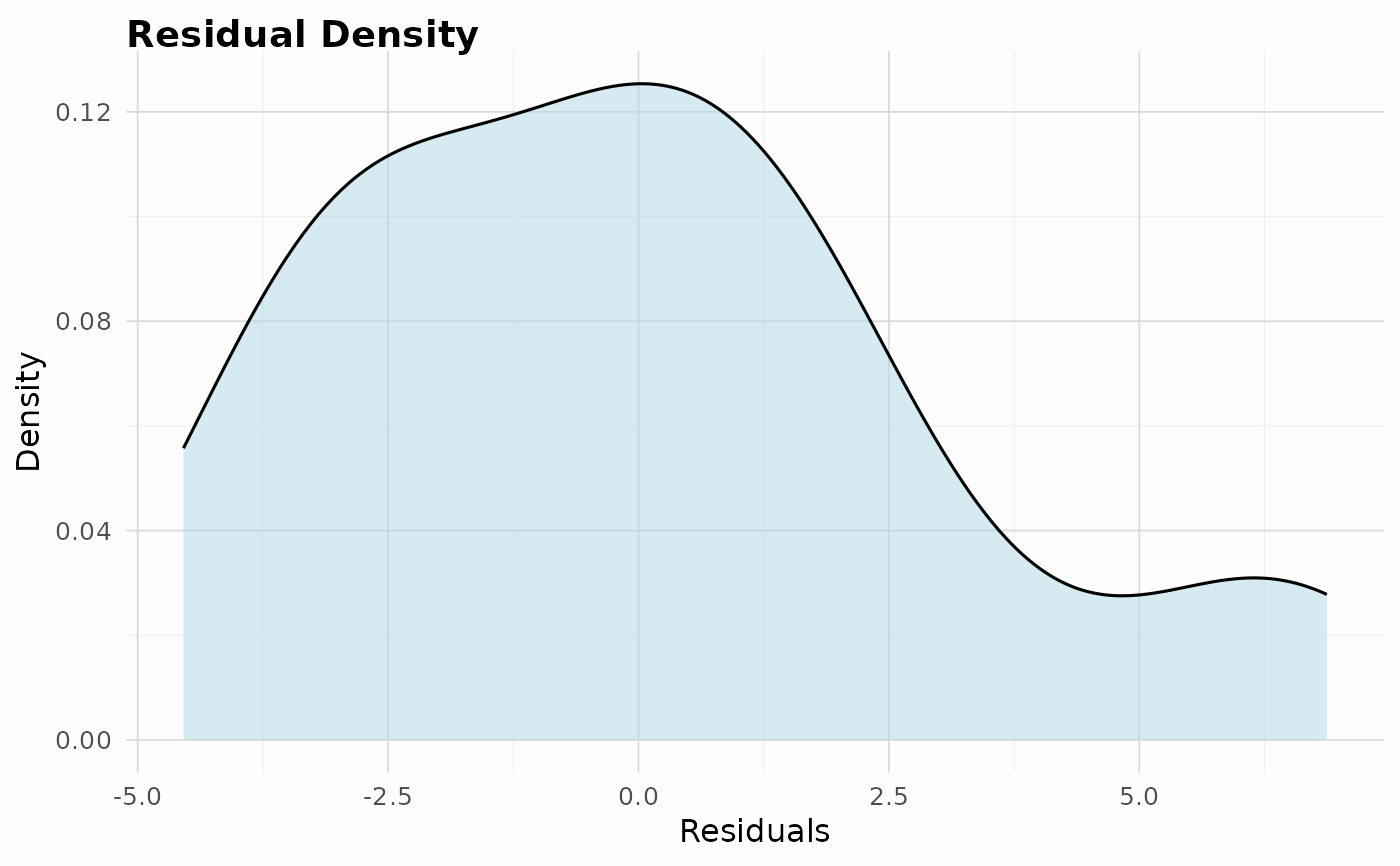
#> $density
#>
#> $density
 #>
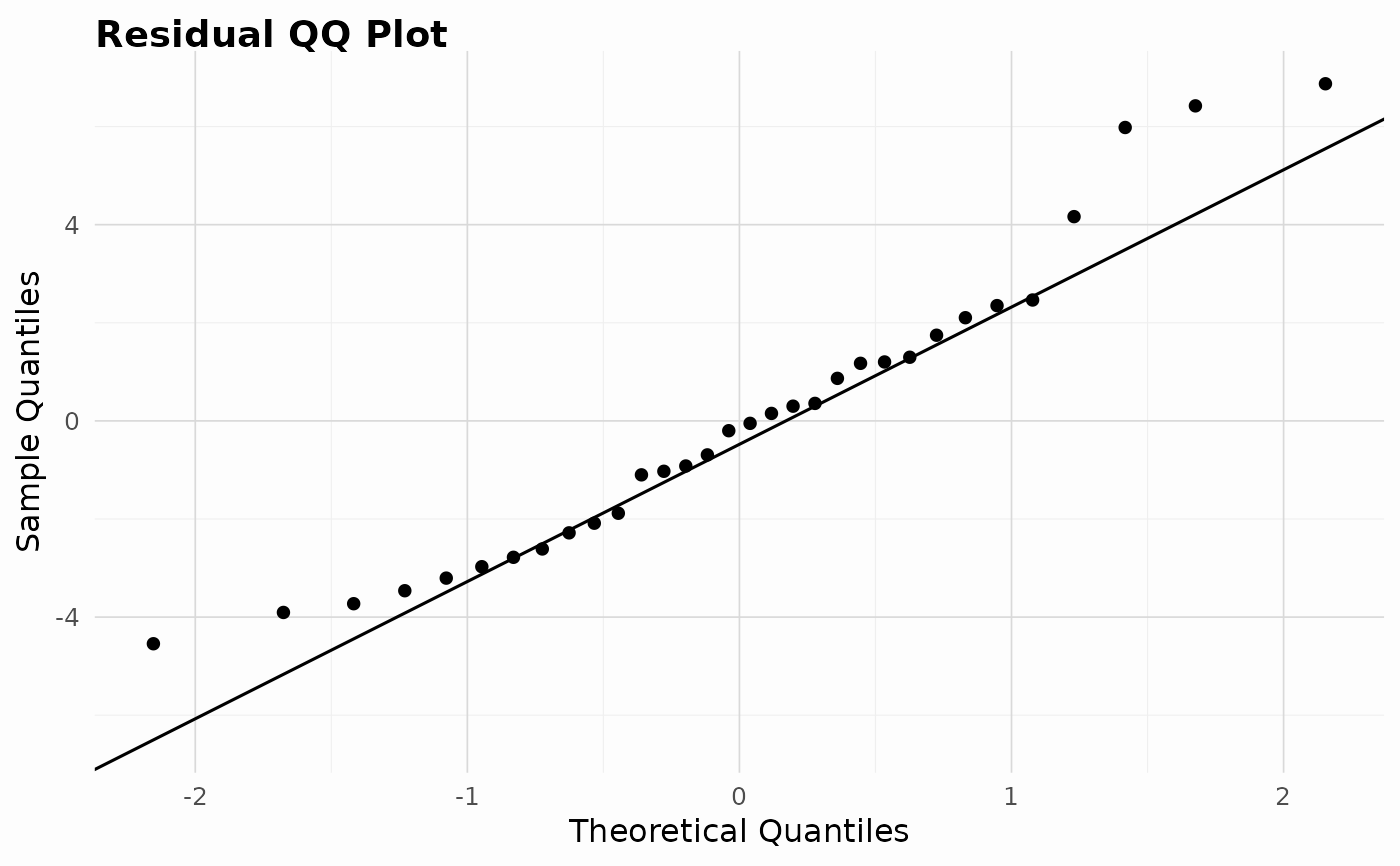
#> $qq
#>
#> $qq
 #>
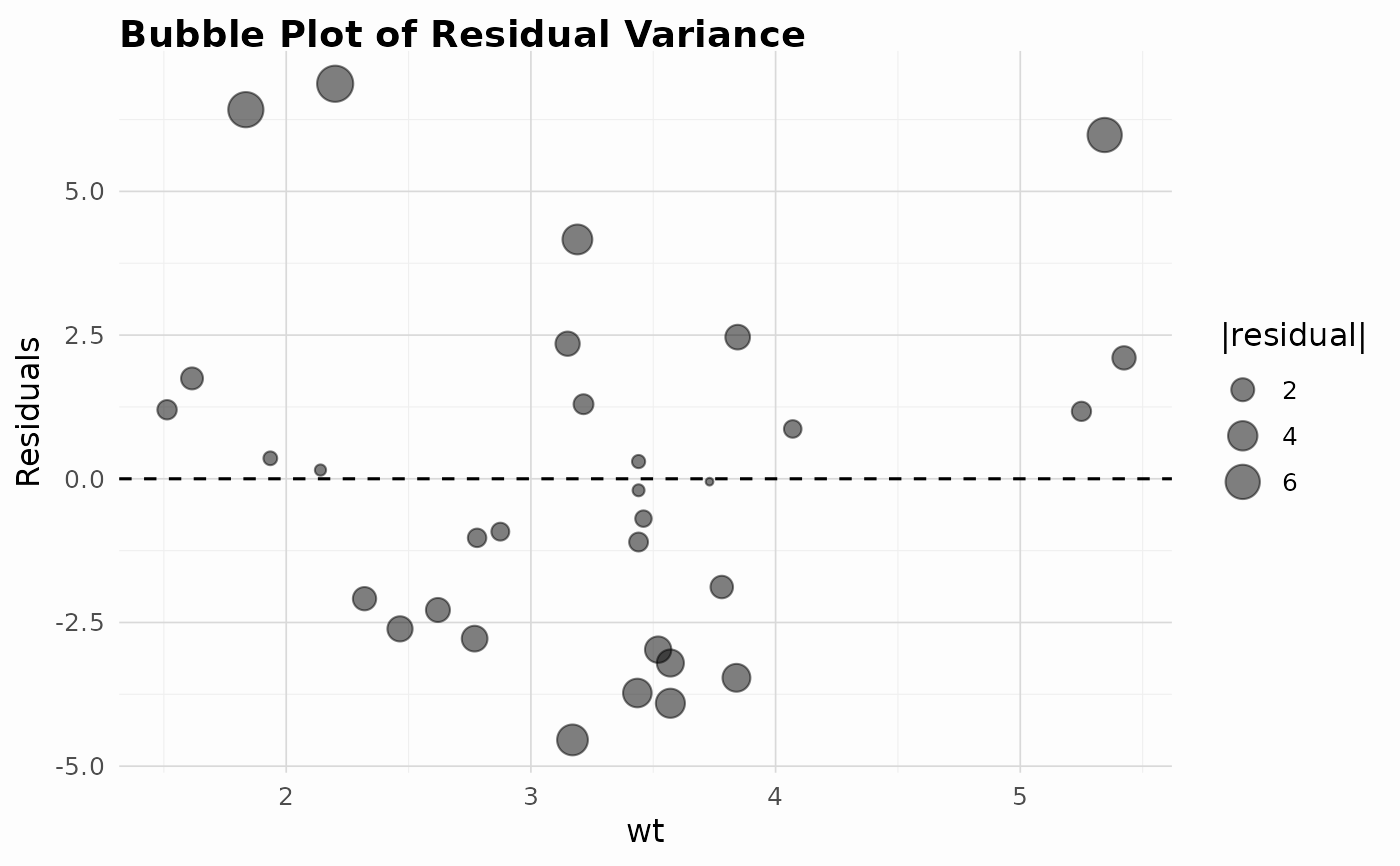
#> $bubble_variance
#>
#> $bubble_variance
 #>
#>