R/plotDiagnostics.R
plotSpreadLevel.Rd
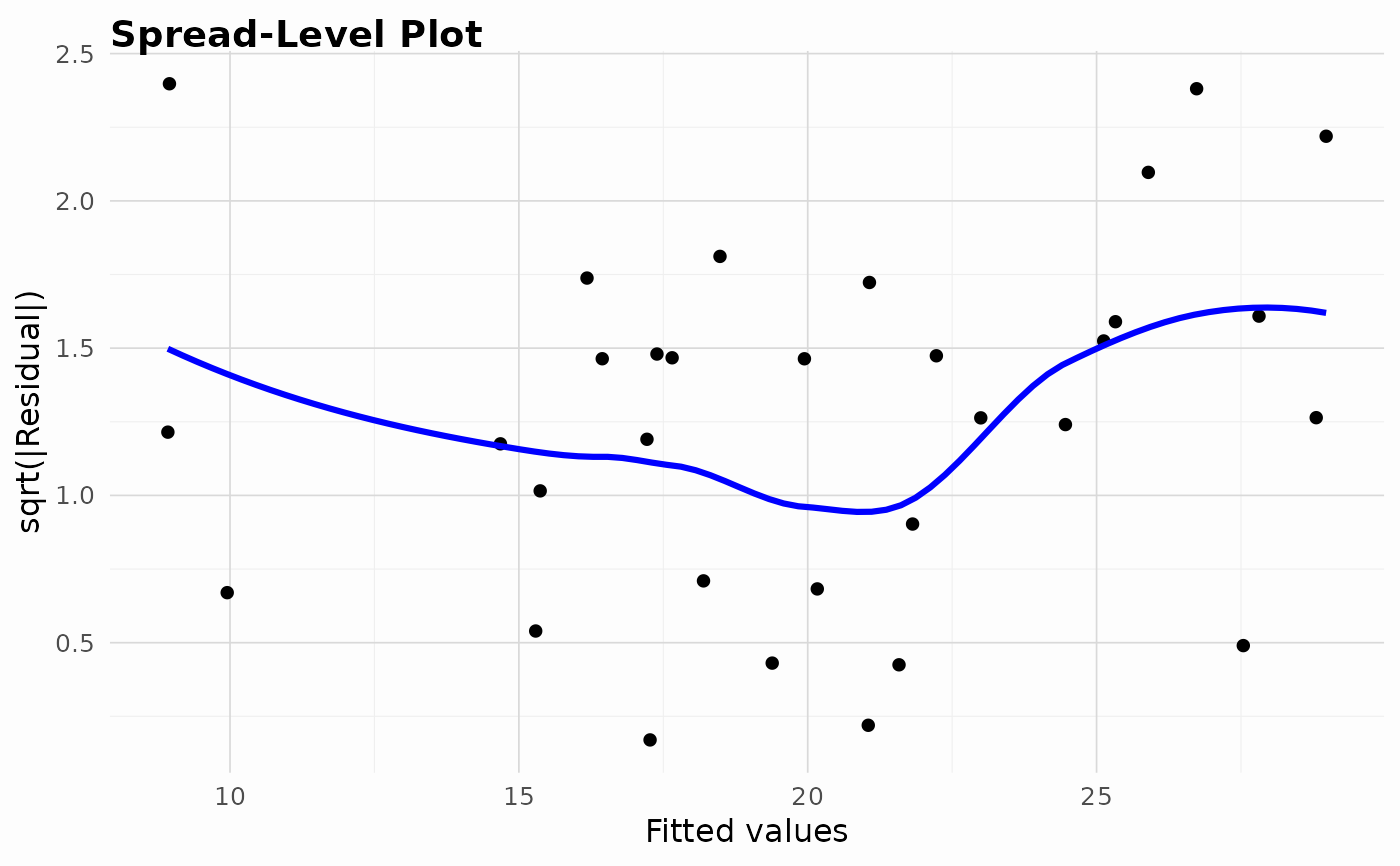
Plots the square root of the absolute residuals against fitted values. A lowess smooth is added to highlight trends.
plotSpreadLevel(model)
A fitted model of class lm.
lm
A ggplot object.
ggplot
data(mtcars)
m <- lm(mpg ~ wt + qsec, data = mtcars)
plotSpreadLevel(m)
#> `geom_smooth()` using formula = 'y ~ x'