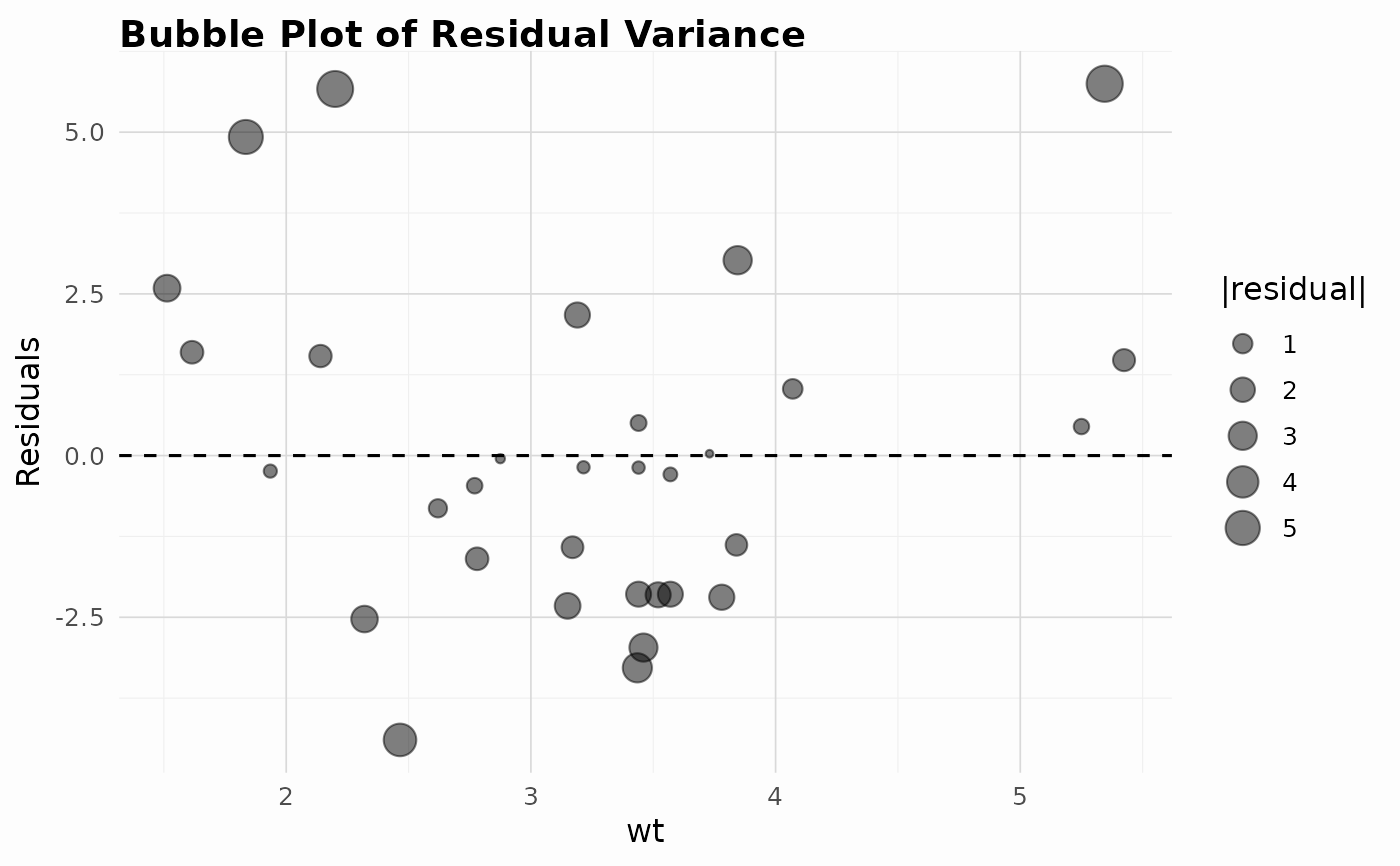
Displays residual magnitude against a predictor with bubble size
proportional to |residual|.
Usage
plotBubbleVariance(model, variable = NULL)
Arguments
- model
A fitted model of class lm or glm.
- variable
Optional name of a covariate from the model to plot against.
Examples
data(mtcars)
m <- lm(mpg ~ wt + qsec, data = mtcars)
plotBubbleVariance(m, "wt")