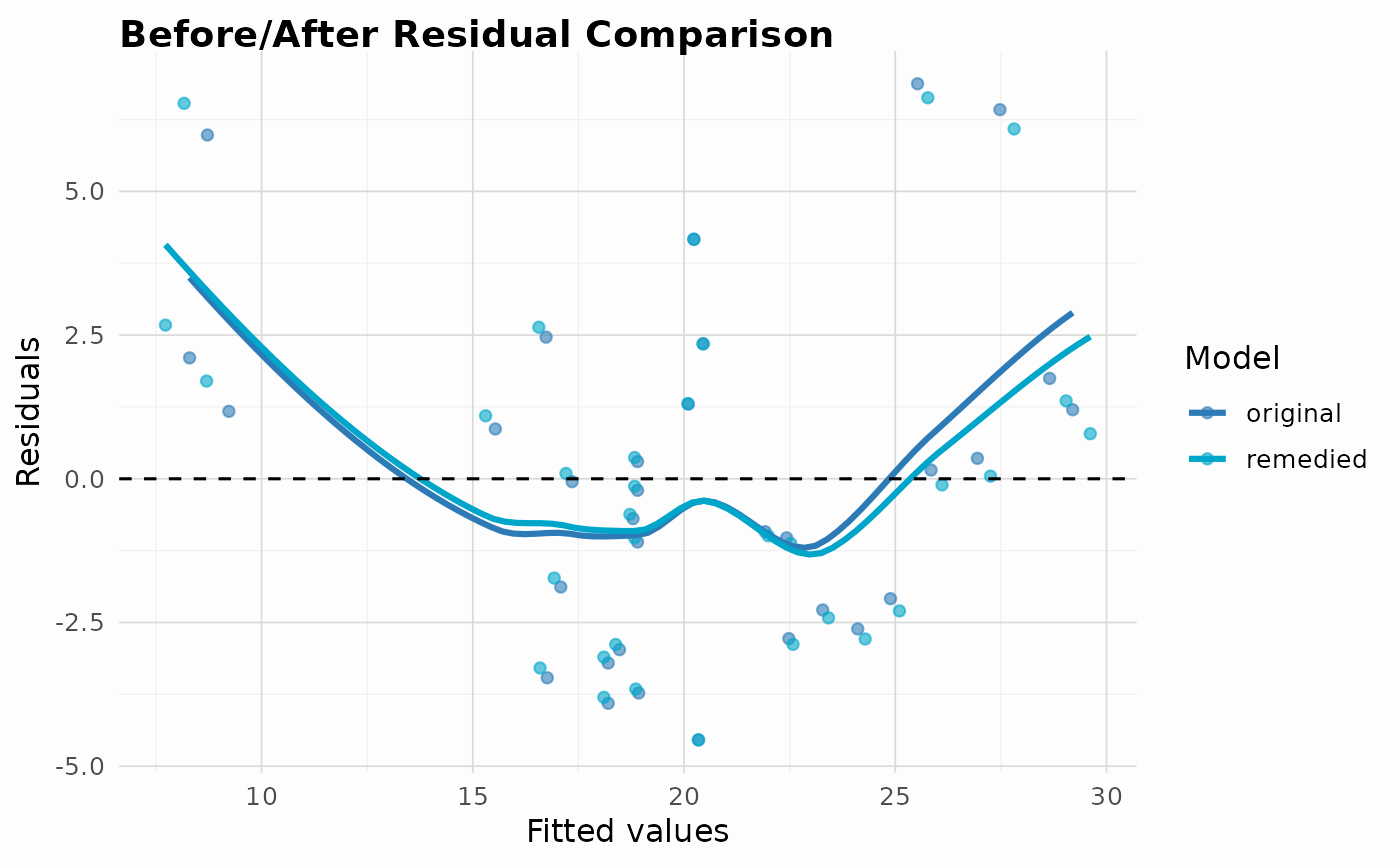
Overlays residuals of two models on a single plot to visualise improvement after applying a remediation method (e.g. WLS or robust regression).
Overlays residuals of two models on a single plot to visualise improvement after applying a remediation method (e.g. WLS or robust regression).